Results
For the summaries below it is important to remember a few key things:
- We did not standardize for total area, area per polygon or number of polygons
- The total area for the hexagons was the largest
- We felt that standardization was not necessary for initial exploration. The purpose was not to compare counts per unit area but to compare three different geographic stratification options. Like ranking states by the number of counties. You don’t rank by number of counties per acre in a state.
Biophysical Settings
Average hectares per BpS per unit
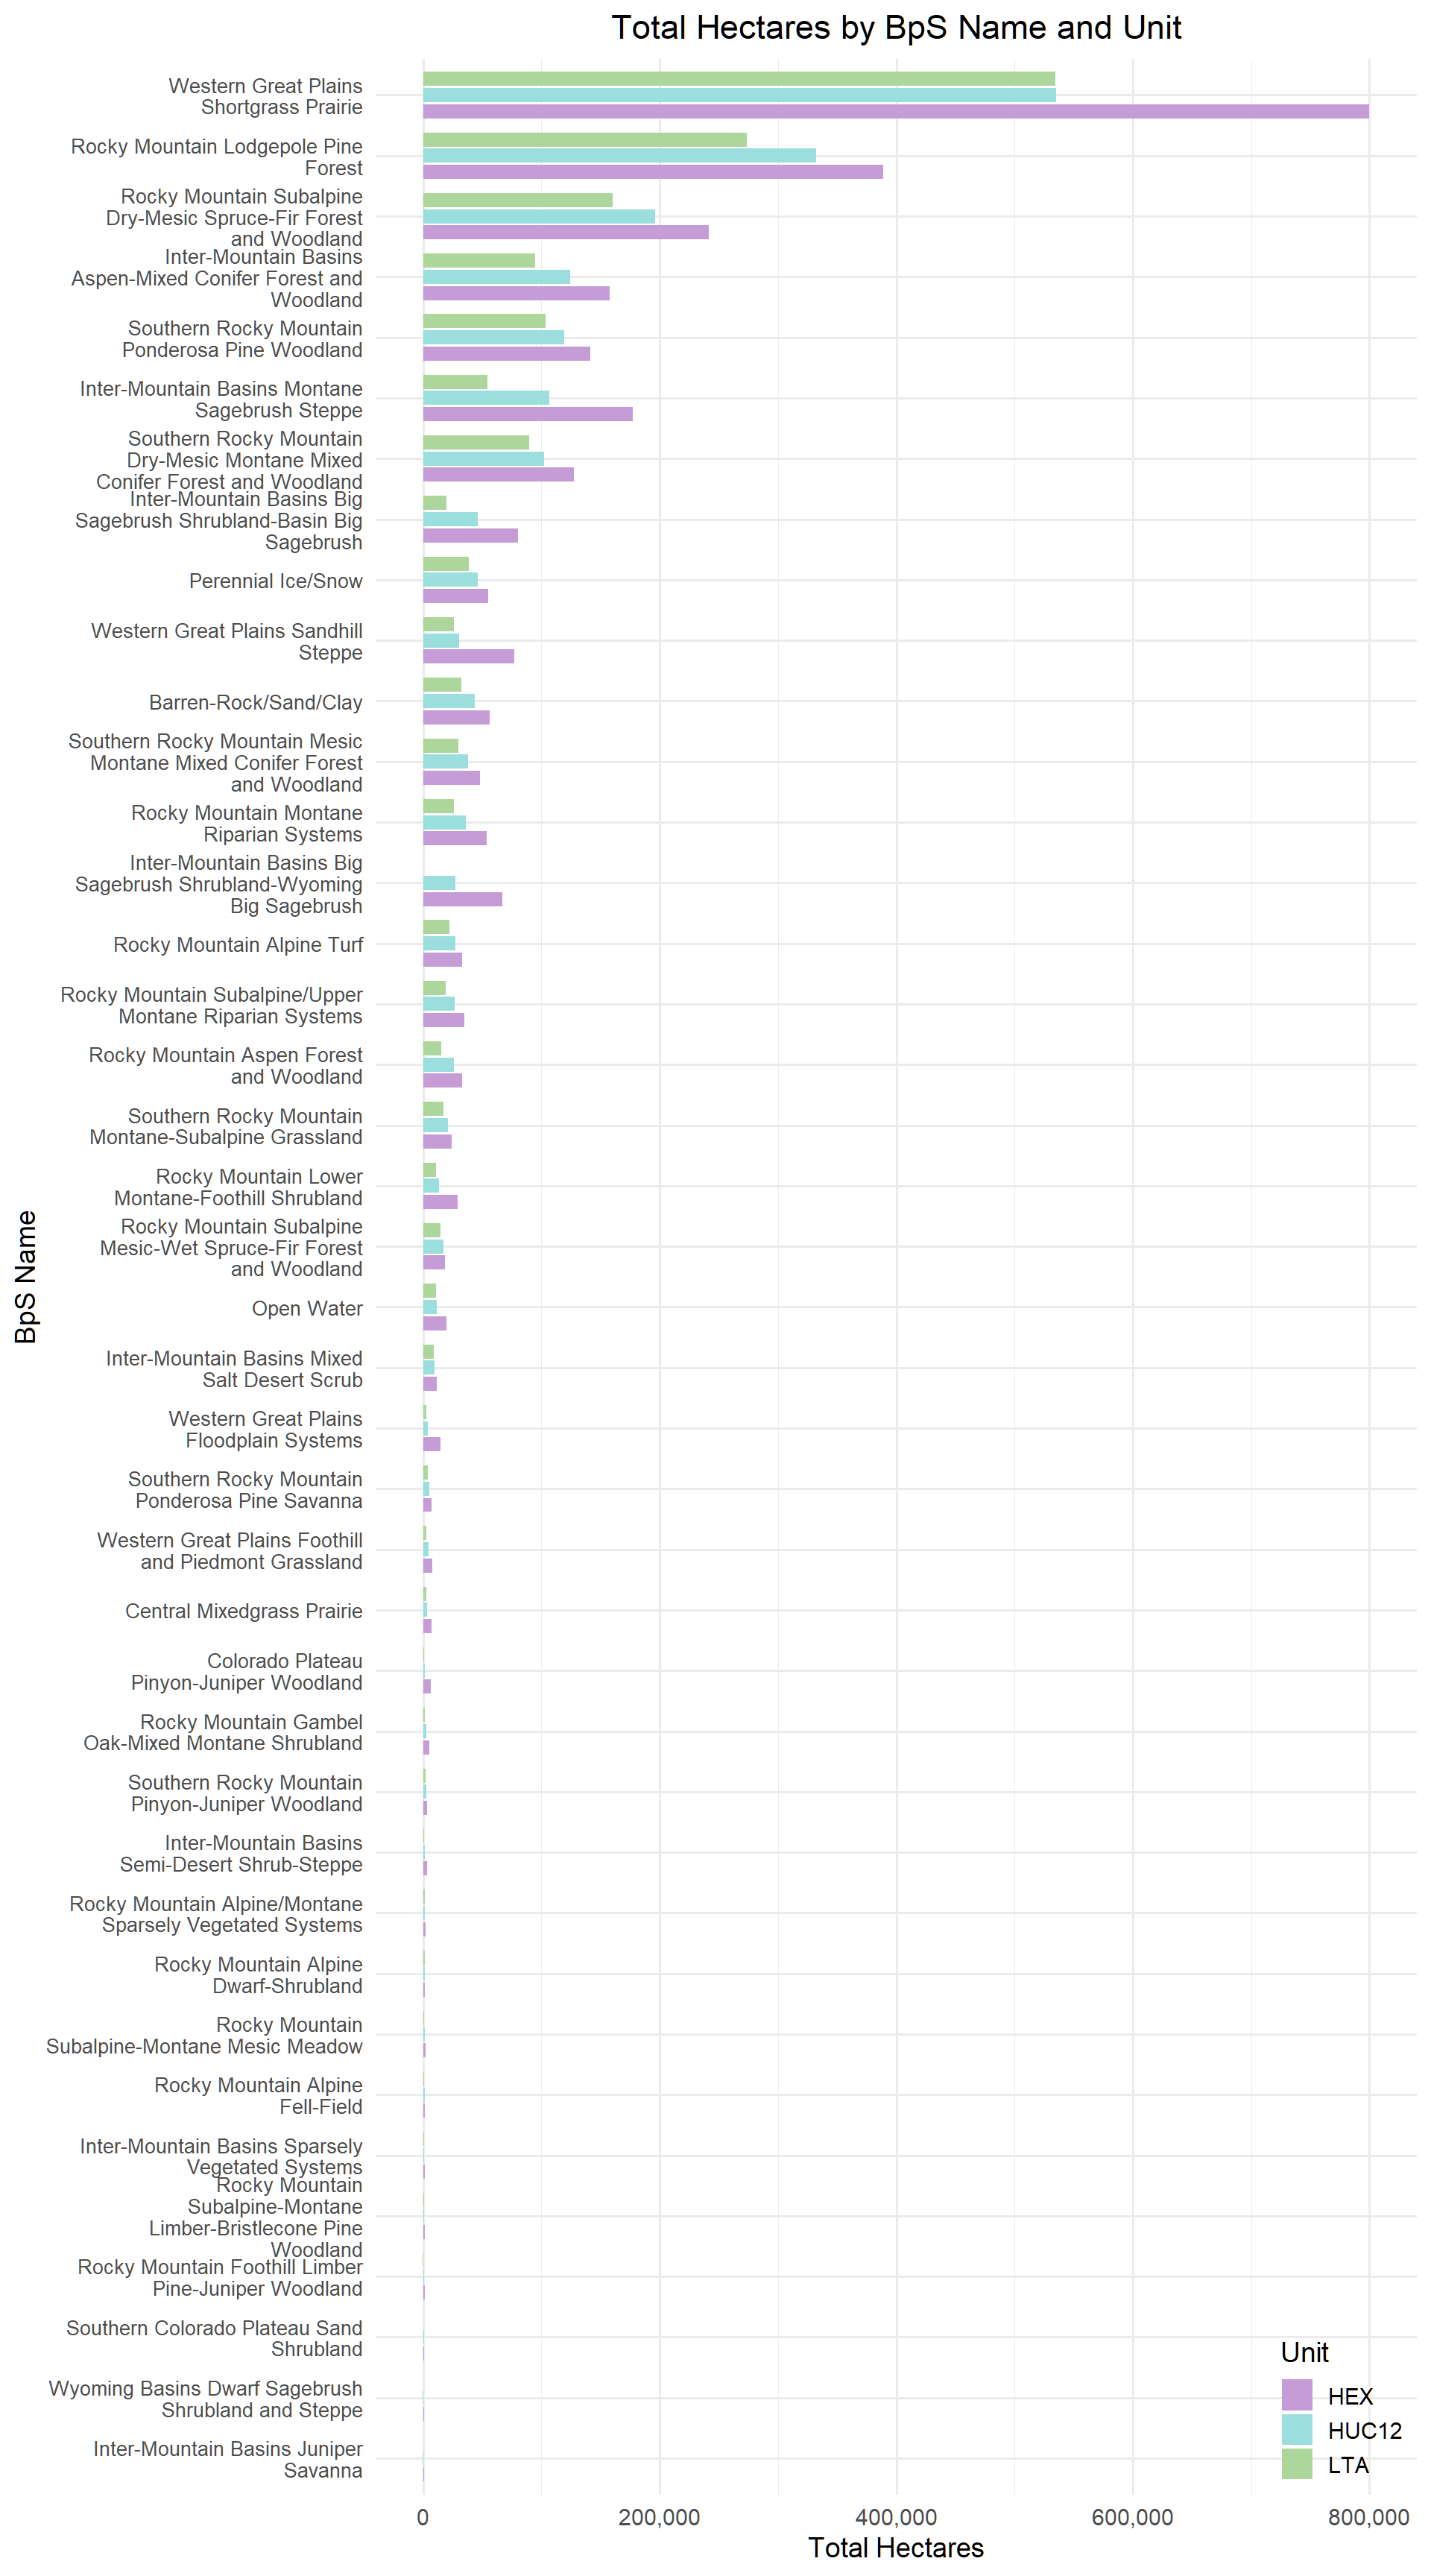
In the chart below we summarized the hectares per BpS_Name for the unit types. This is mostly to showcase which BpSs were dominant as we did not expect any substantial variation in the patterns.
*BpSs with less than 100 ha filtered out.
Comparing the BpS distributions between units
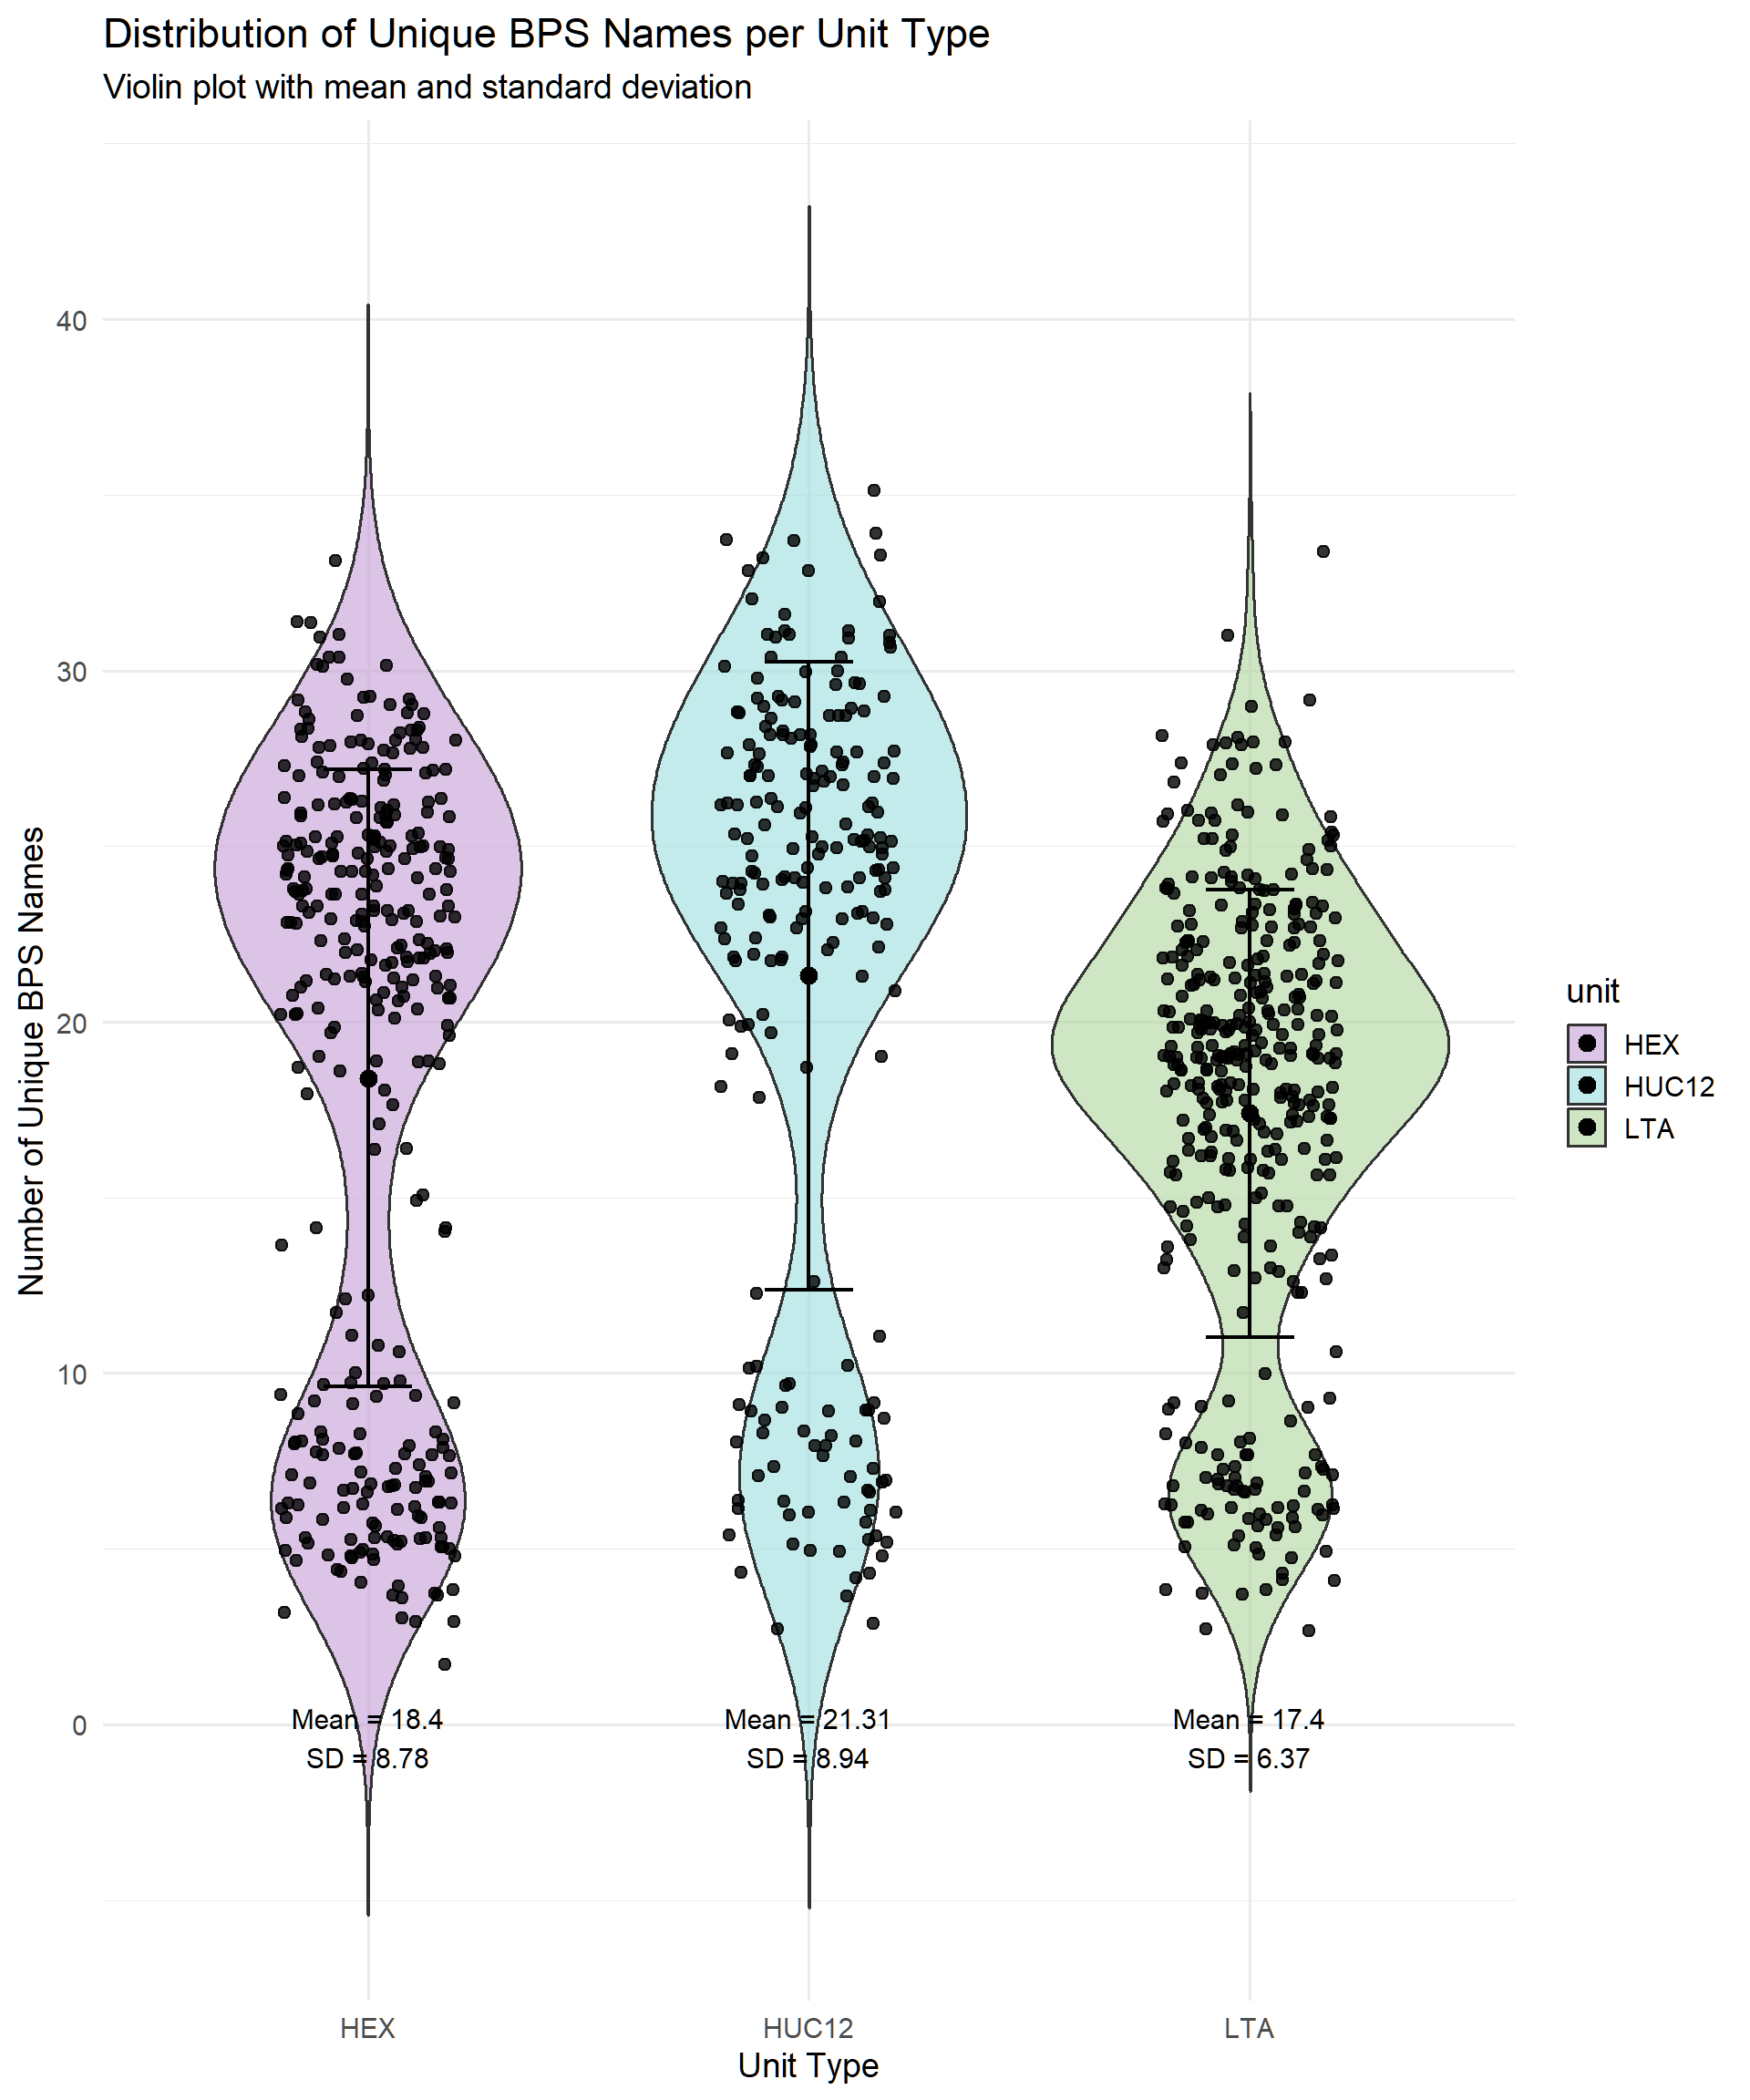
The violin plot below illustrates the distribution of BpSs per unit type. Each dot is the number of BpSs for a polygon.
Quick statistical look at BpSs
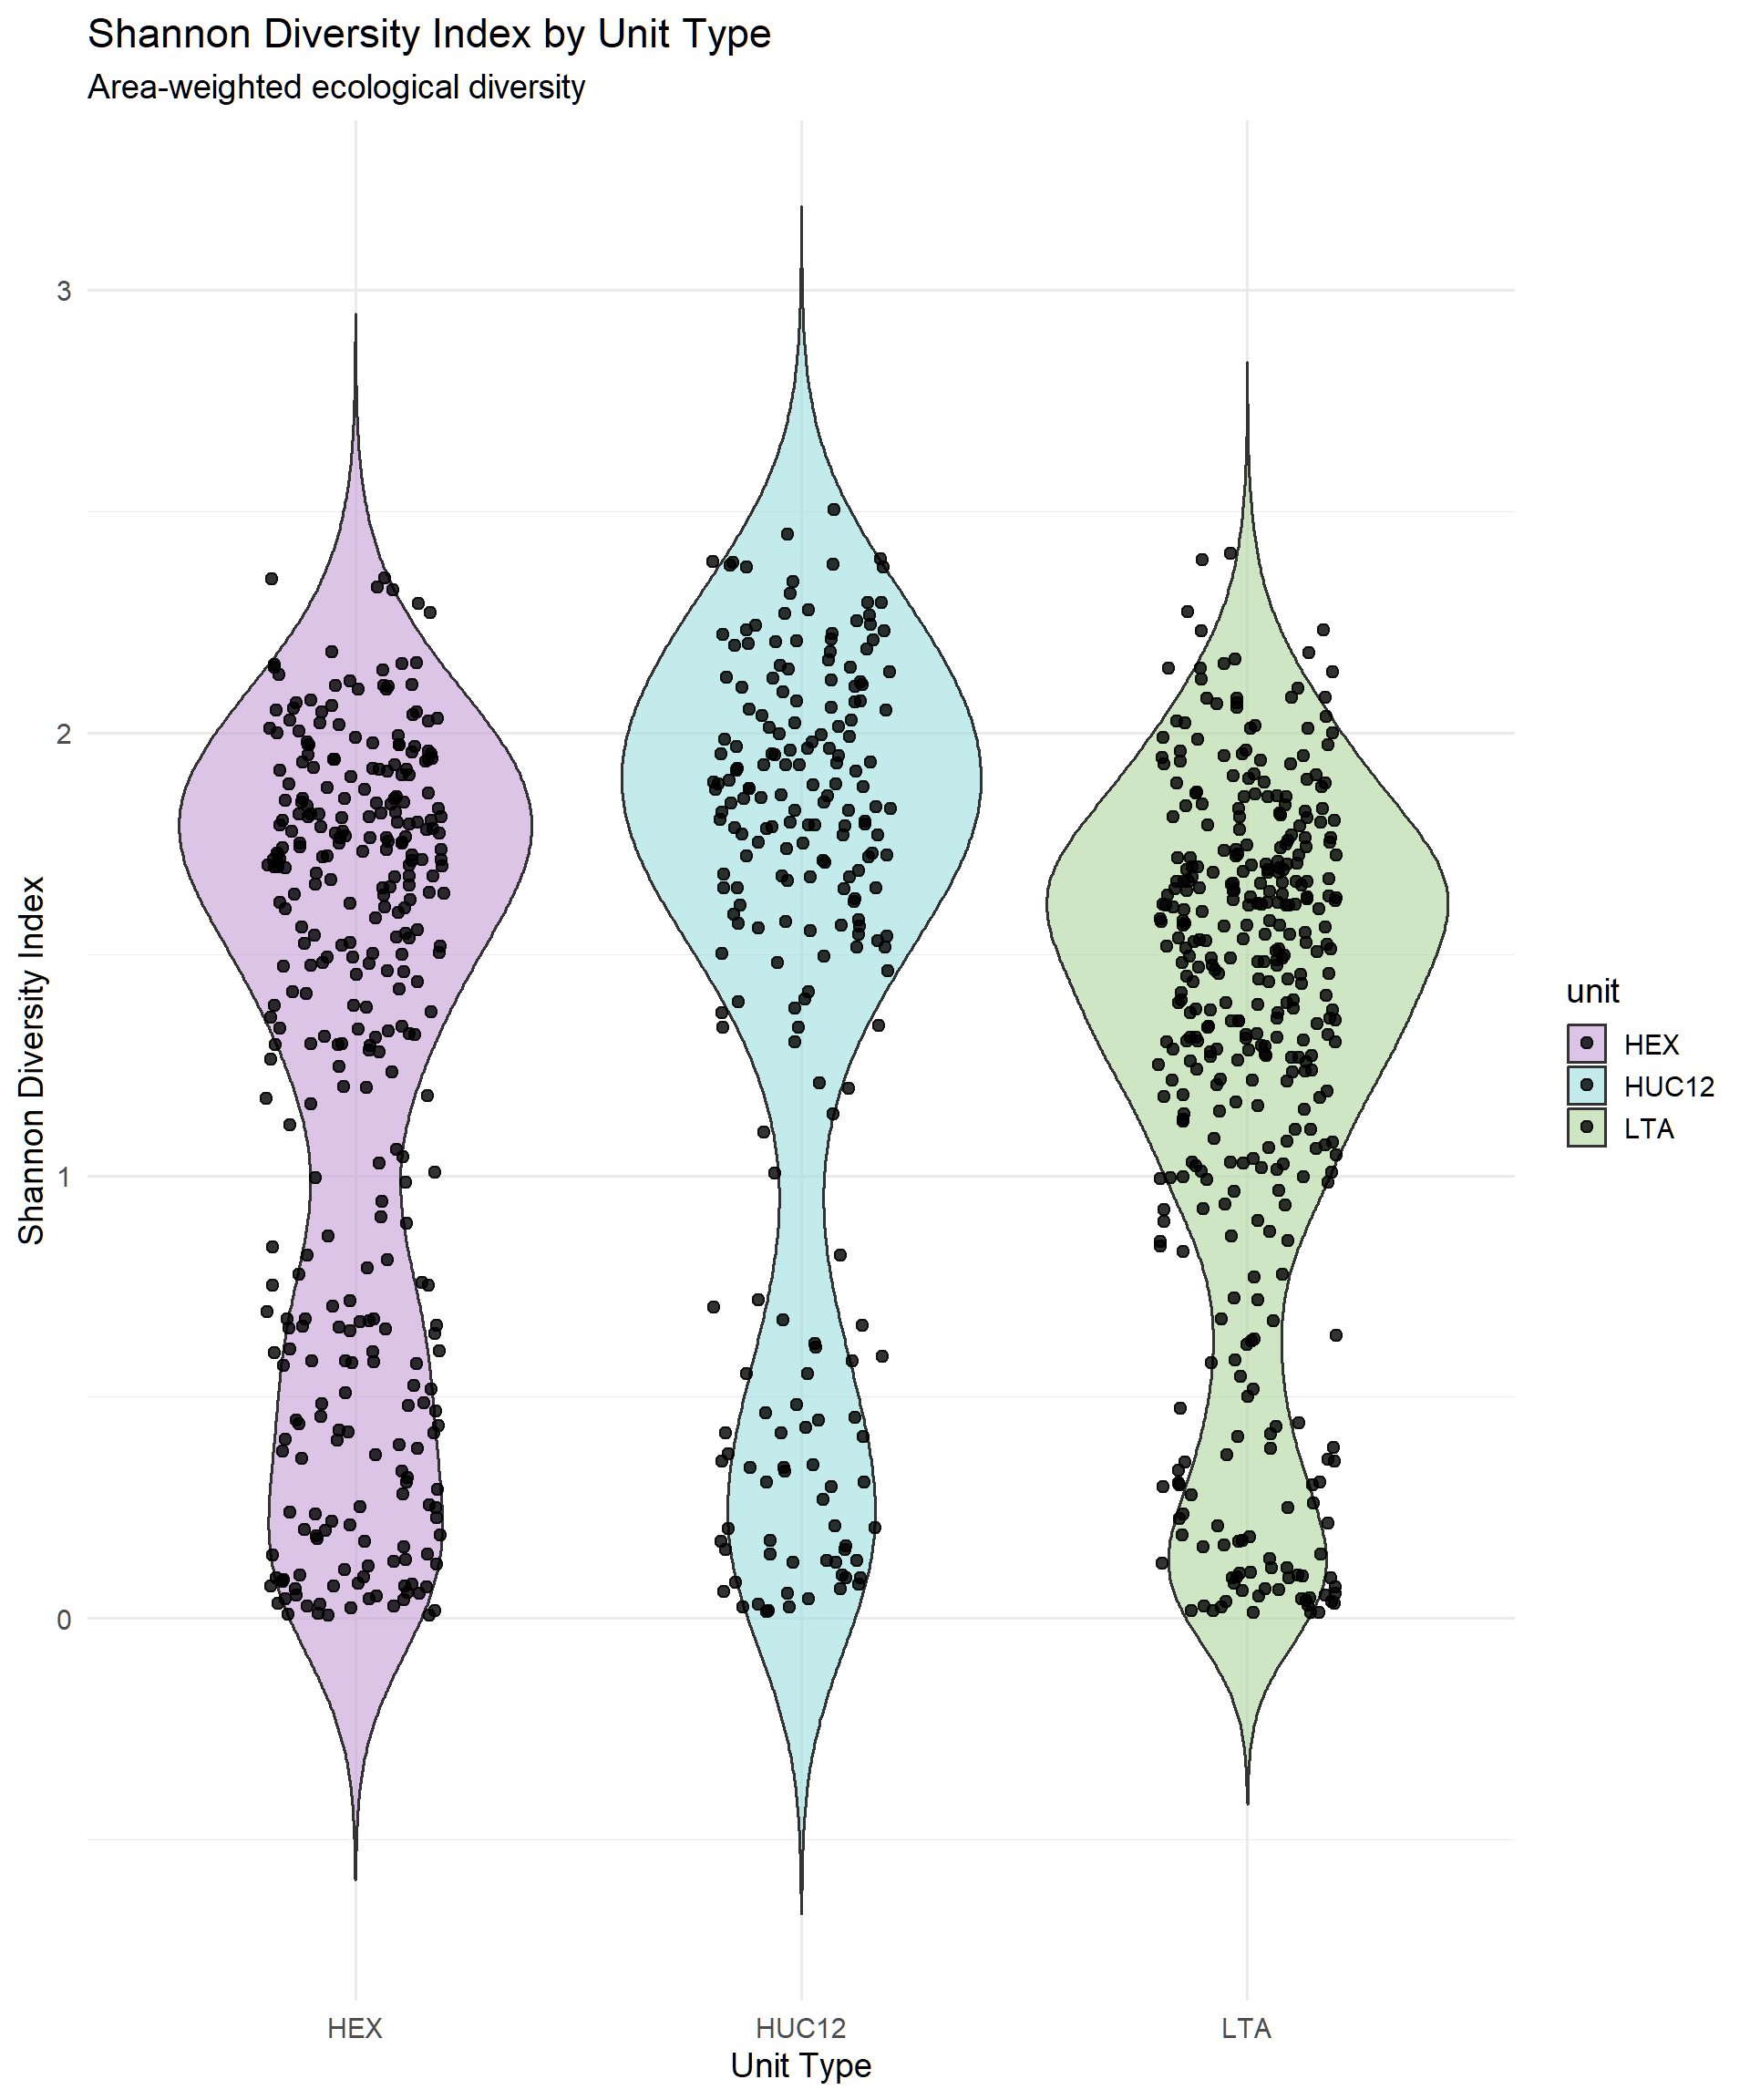
Below we calculate Shannon’s Diversity Index per unit type, area-weighted.
Statistical Analysisof BpSs
We used a Kruskal-Wallis test to assess differences in Shannon Diversity Index across unit types. This non-parametric test is appropriate for comparing distributions when assumptions of normality may not be met.
The test formula was:
Shannon Diversity Index ~ Unit Type
The results were as follows:
- Kruskal-Wallis Chi-squared: 32.13
- Degrees of freedom: 2
- p-value: 1.05e-07
These results suggest a statistically significant difference in ecological diversity among the unit types.
Existing Vegetation Types
Average hectares per EVT per unit
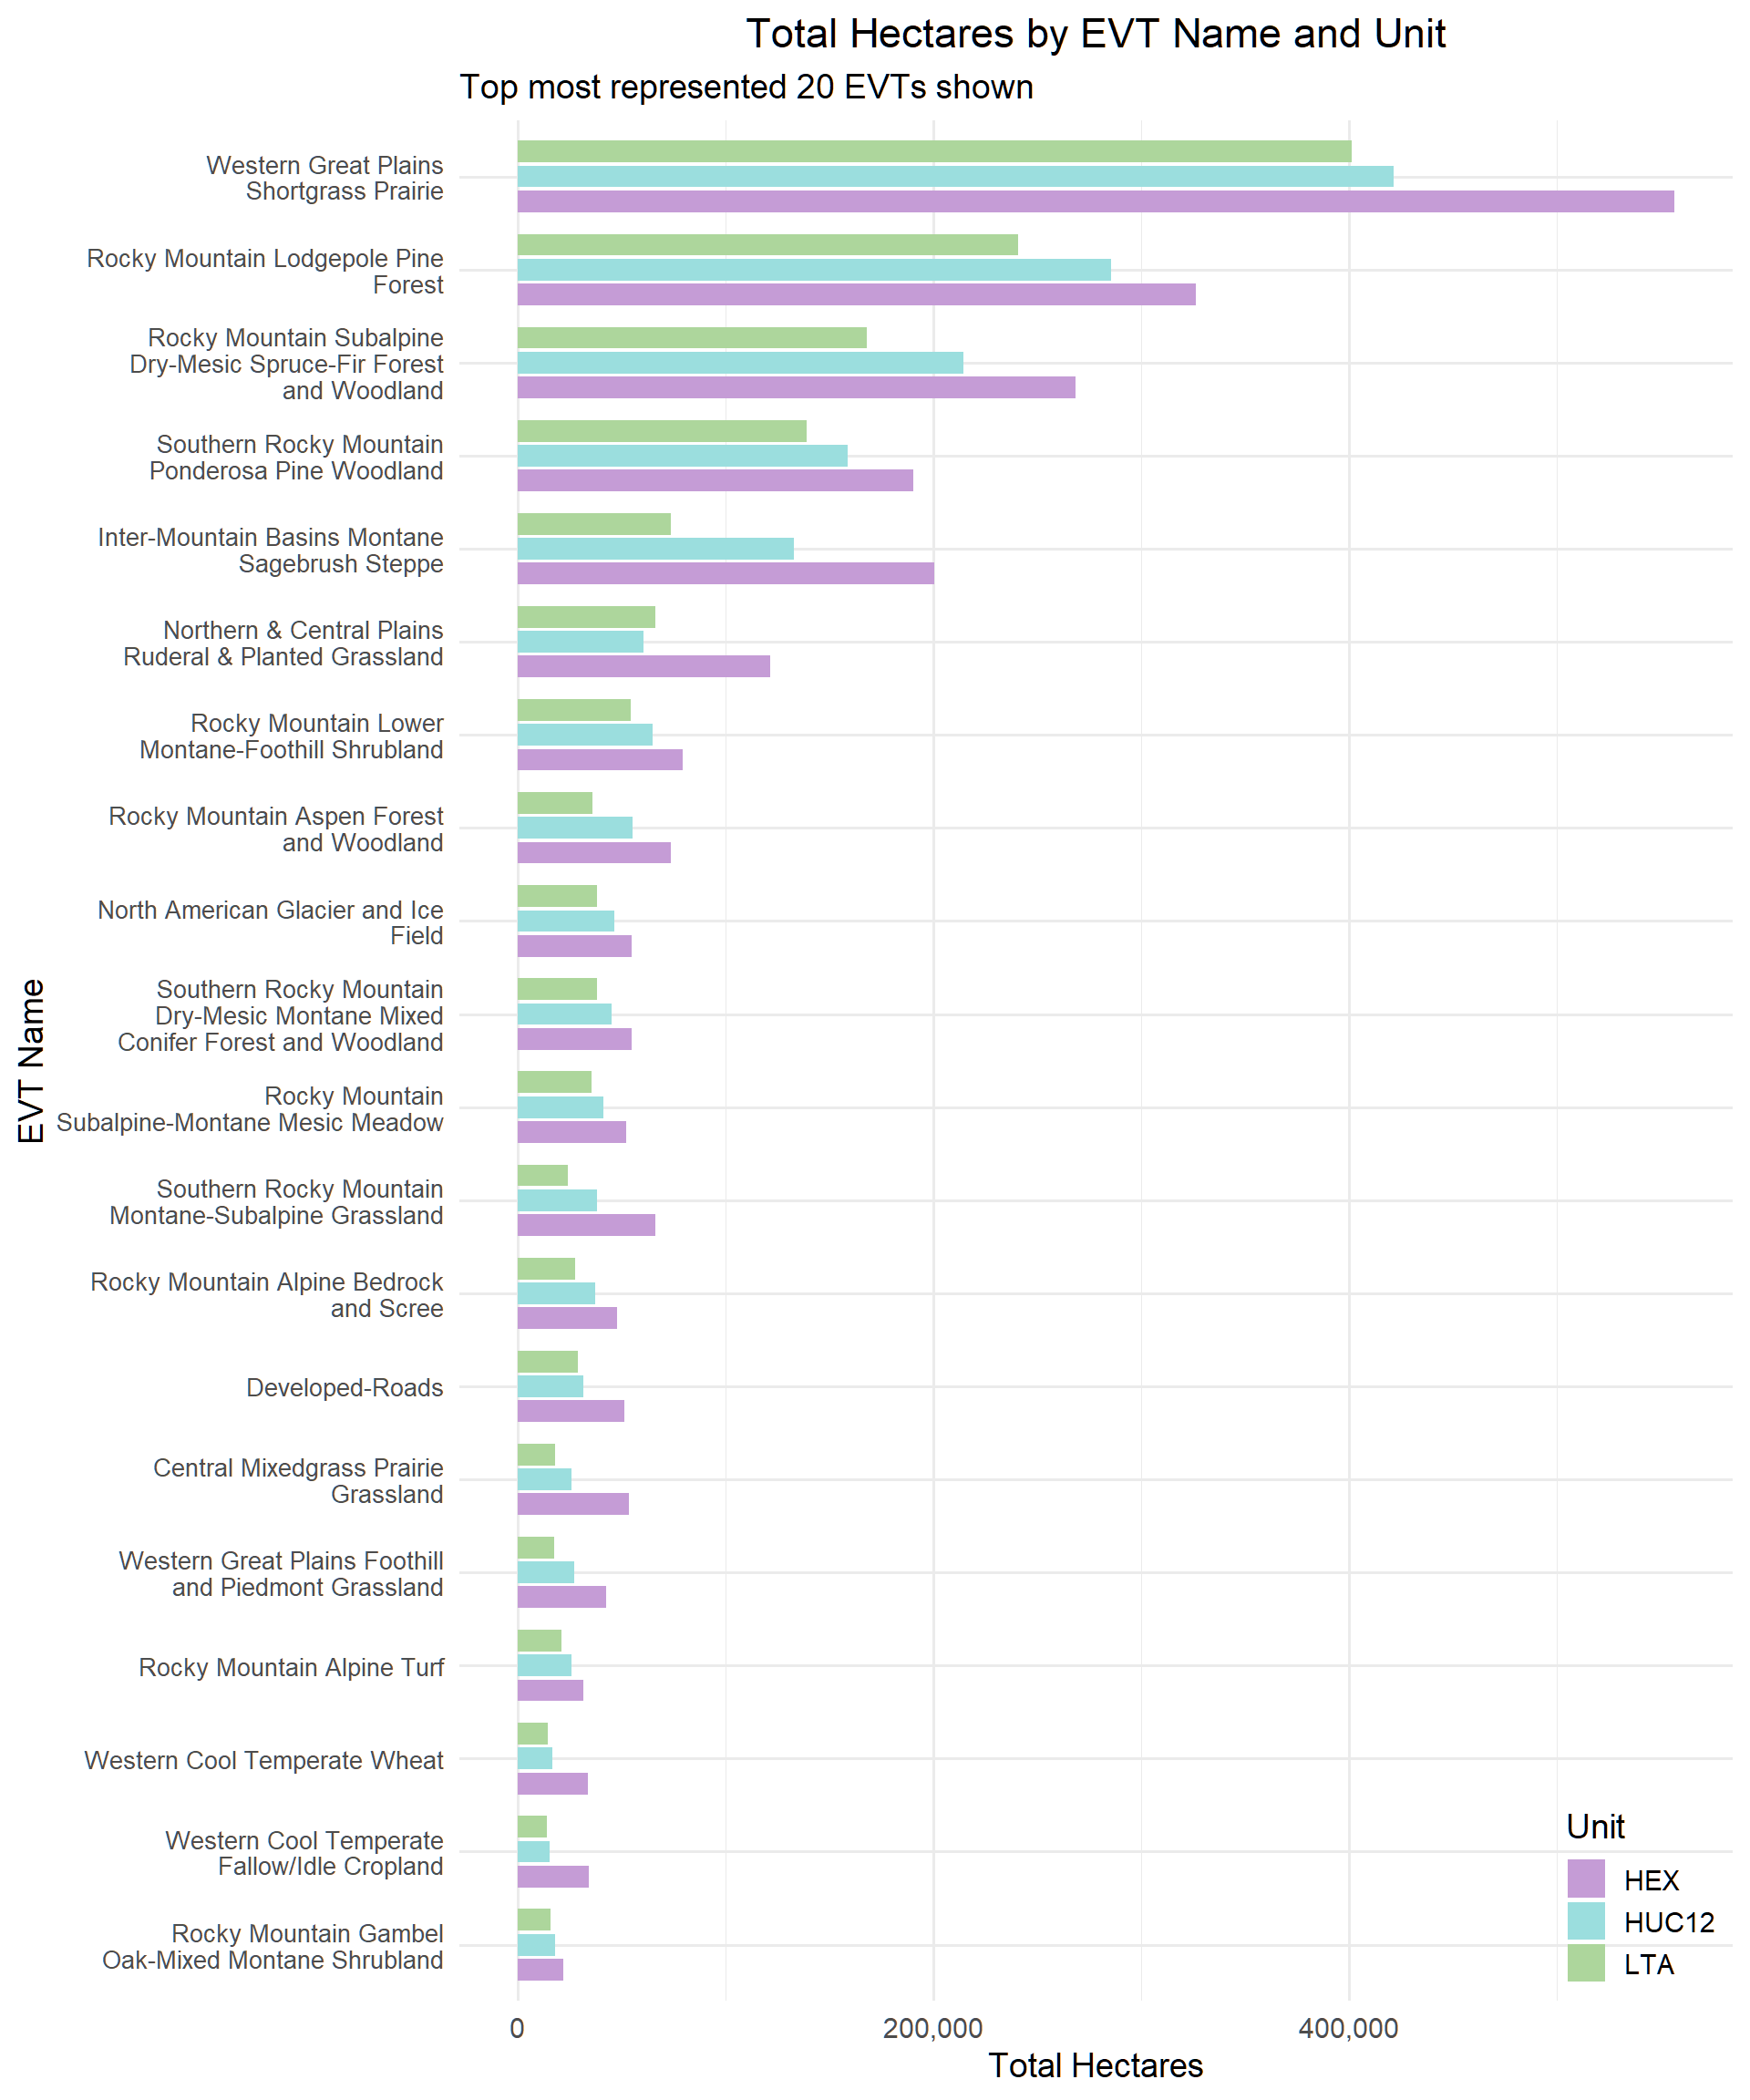
In the chart below we summarized the hectares per BpS_Name for the unit types. This is mostly to showcase which BpSs were dominant as we did not expect any substantial variation in the patterns.
Comparing the EVT distributions between units
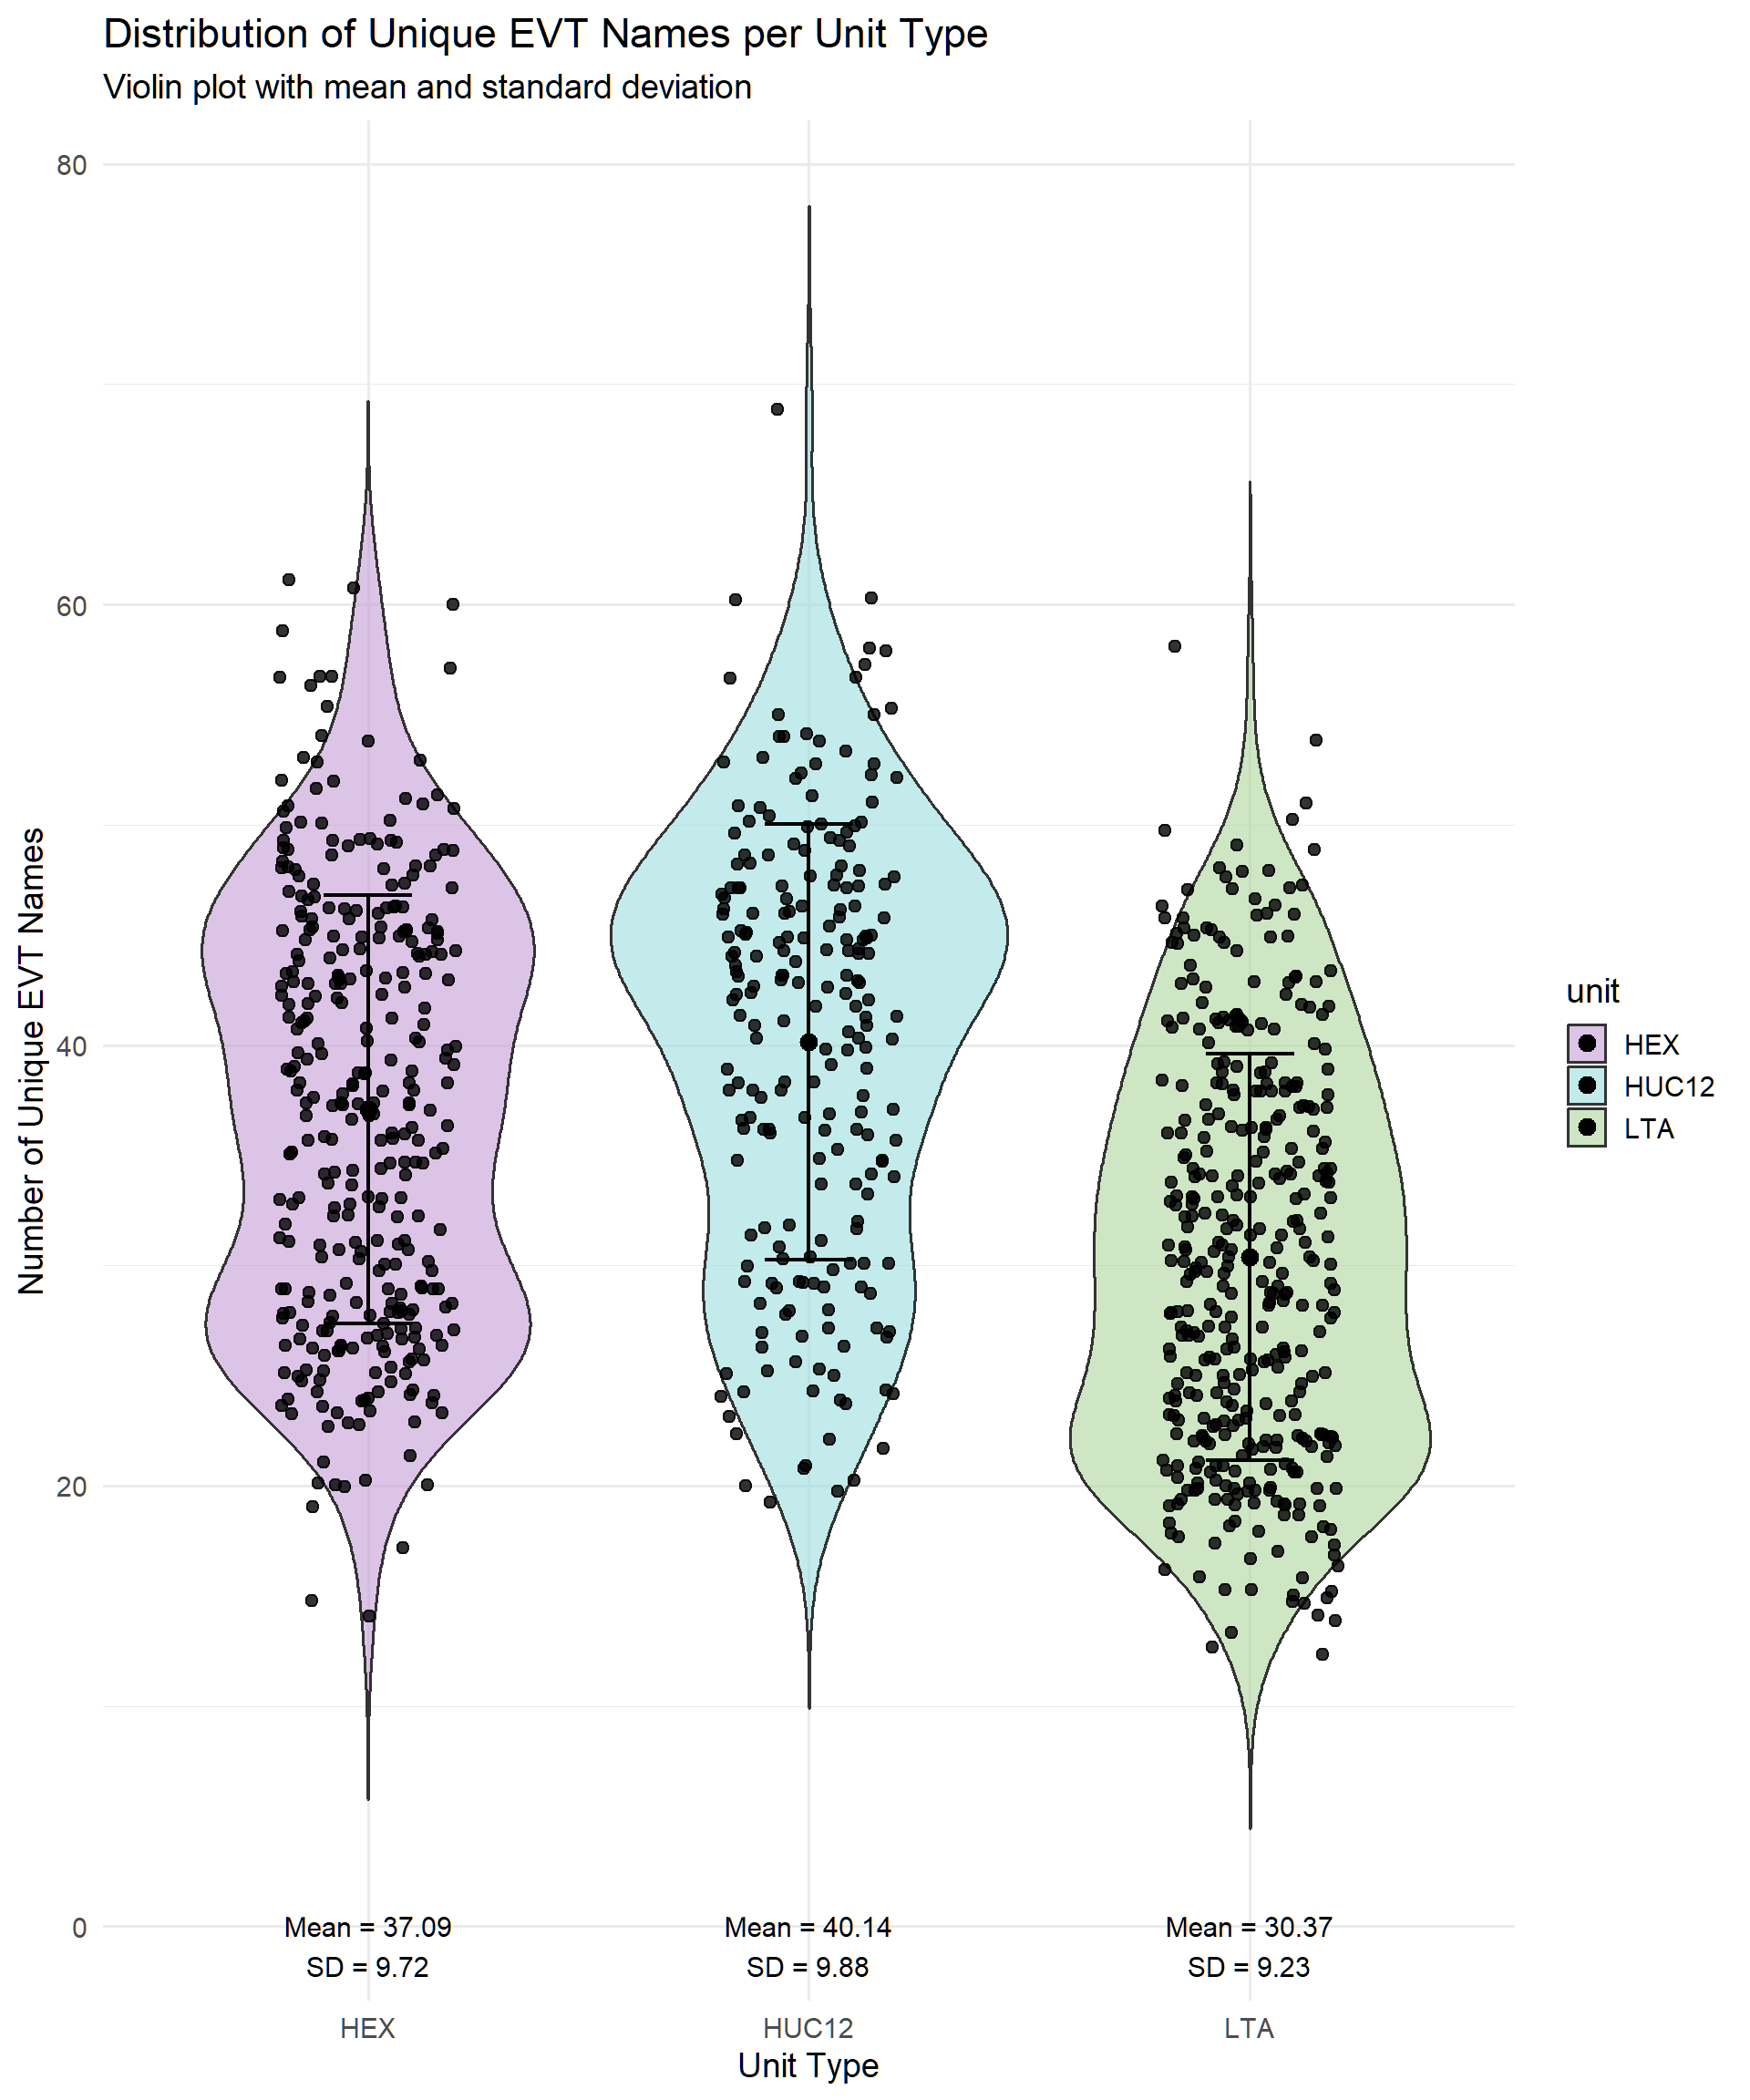
The violin plot below illustrates the distribution of EVTs per unit type. Each dot is the number of EVTs for a polygon.
Quick statistical look at EVTs
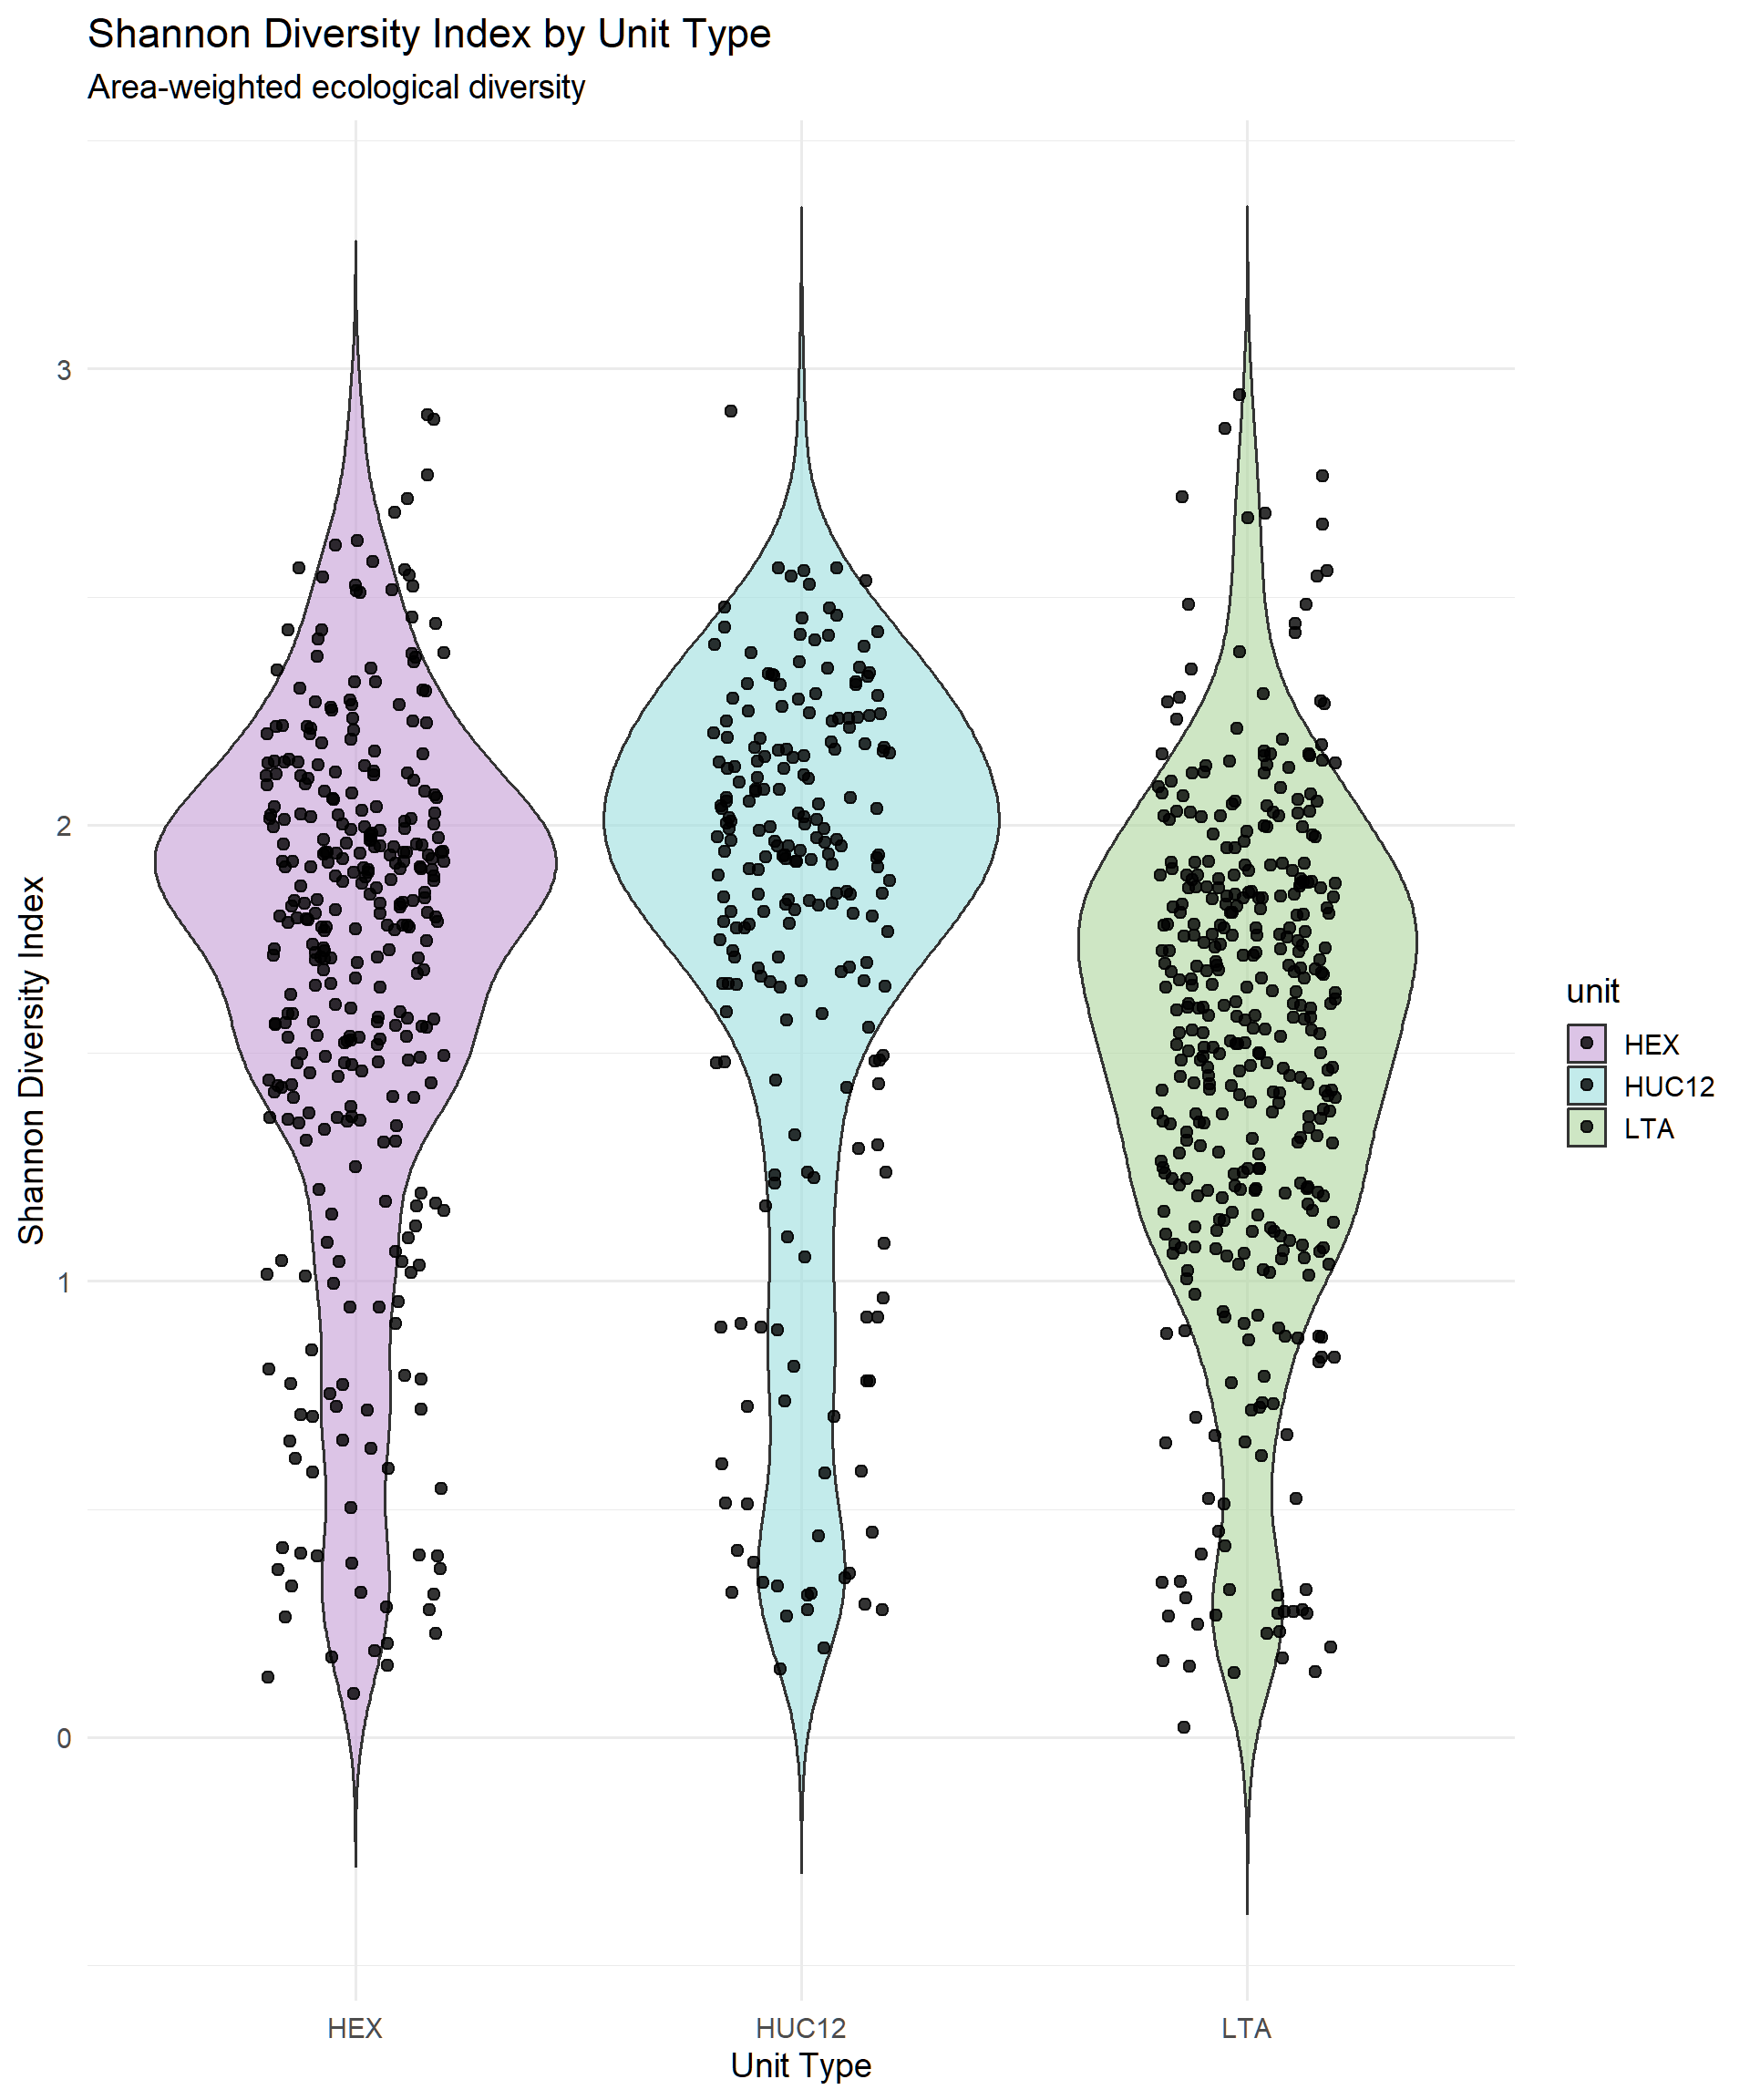
Below we calculate Shannon’s Diversity Index per unit type, area-weighted.
Statistical Analysis of EVTs
We used a Kruskal-Wallis test to assess differences in Shannon Diversity Index across unit types. This non-parametric test is appropriate for comparing distributions when assumptions of normality may not be met.
The test formula was:
Shannon Diversity Index ~ Unit Type
The results were as follows:
- Kruskal-Wallis Chi-squared: 53.46
- Degrees of freedom: 2
- p-value: 2.46e-12
These results suggest a statistically significant difference in ecological diversity among the unit types.