Current Vegetation
Patterns on the current landscape
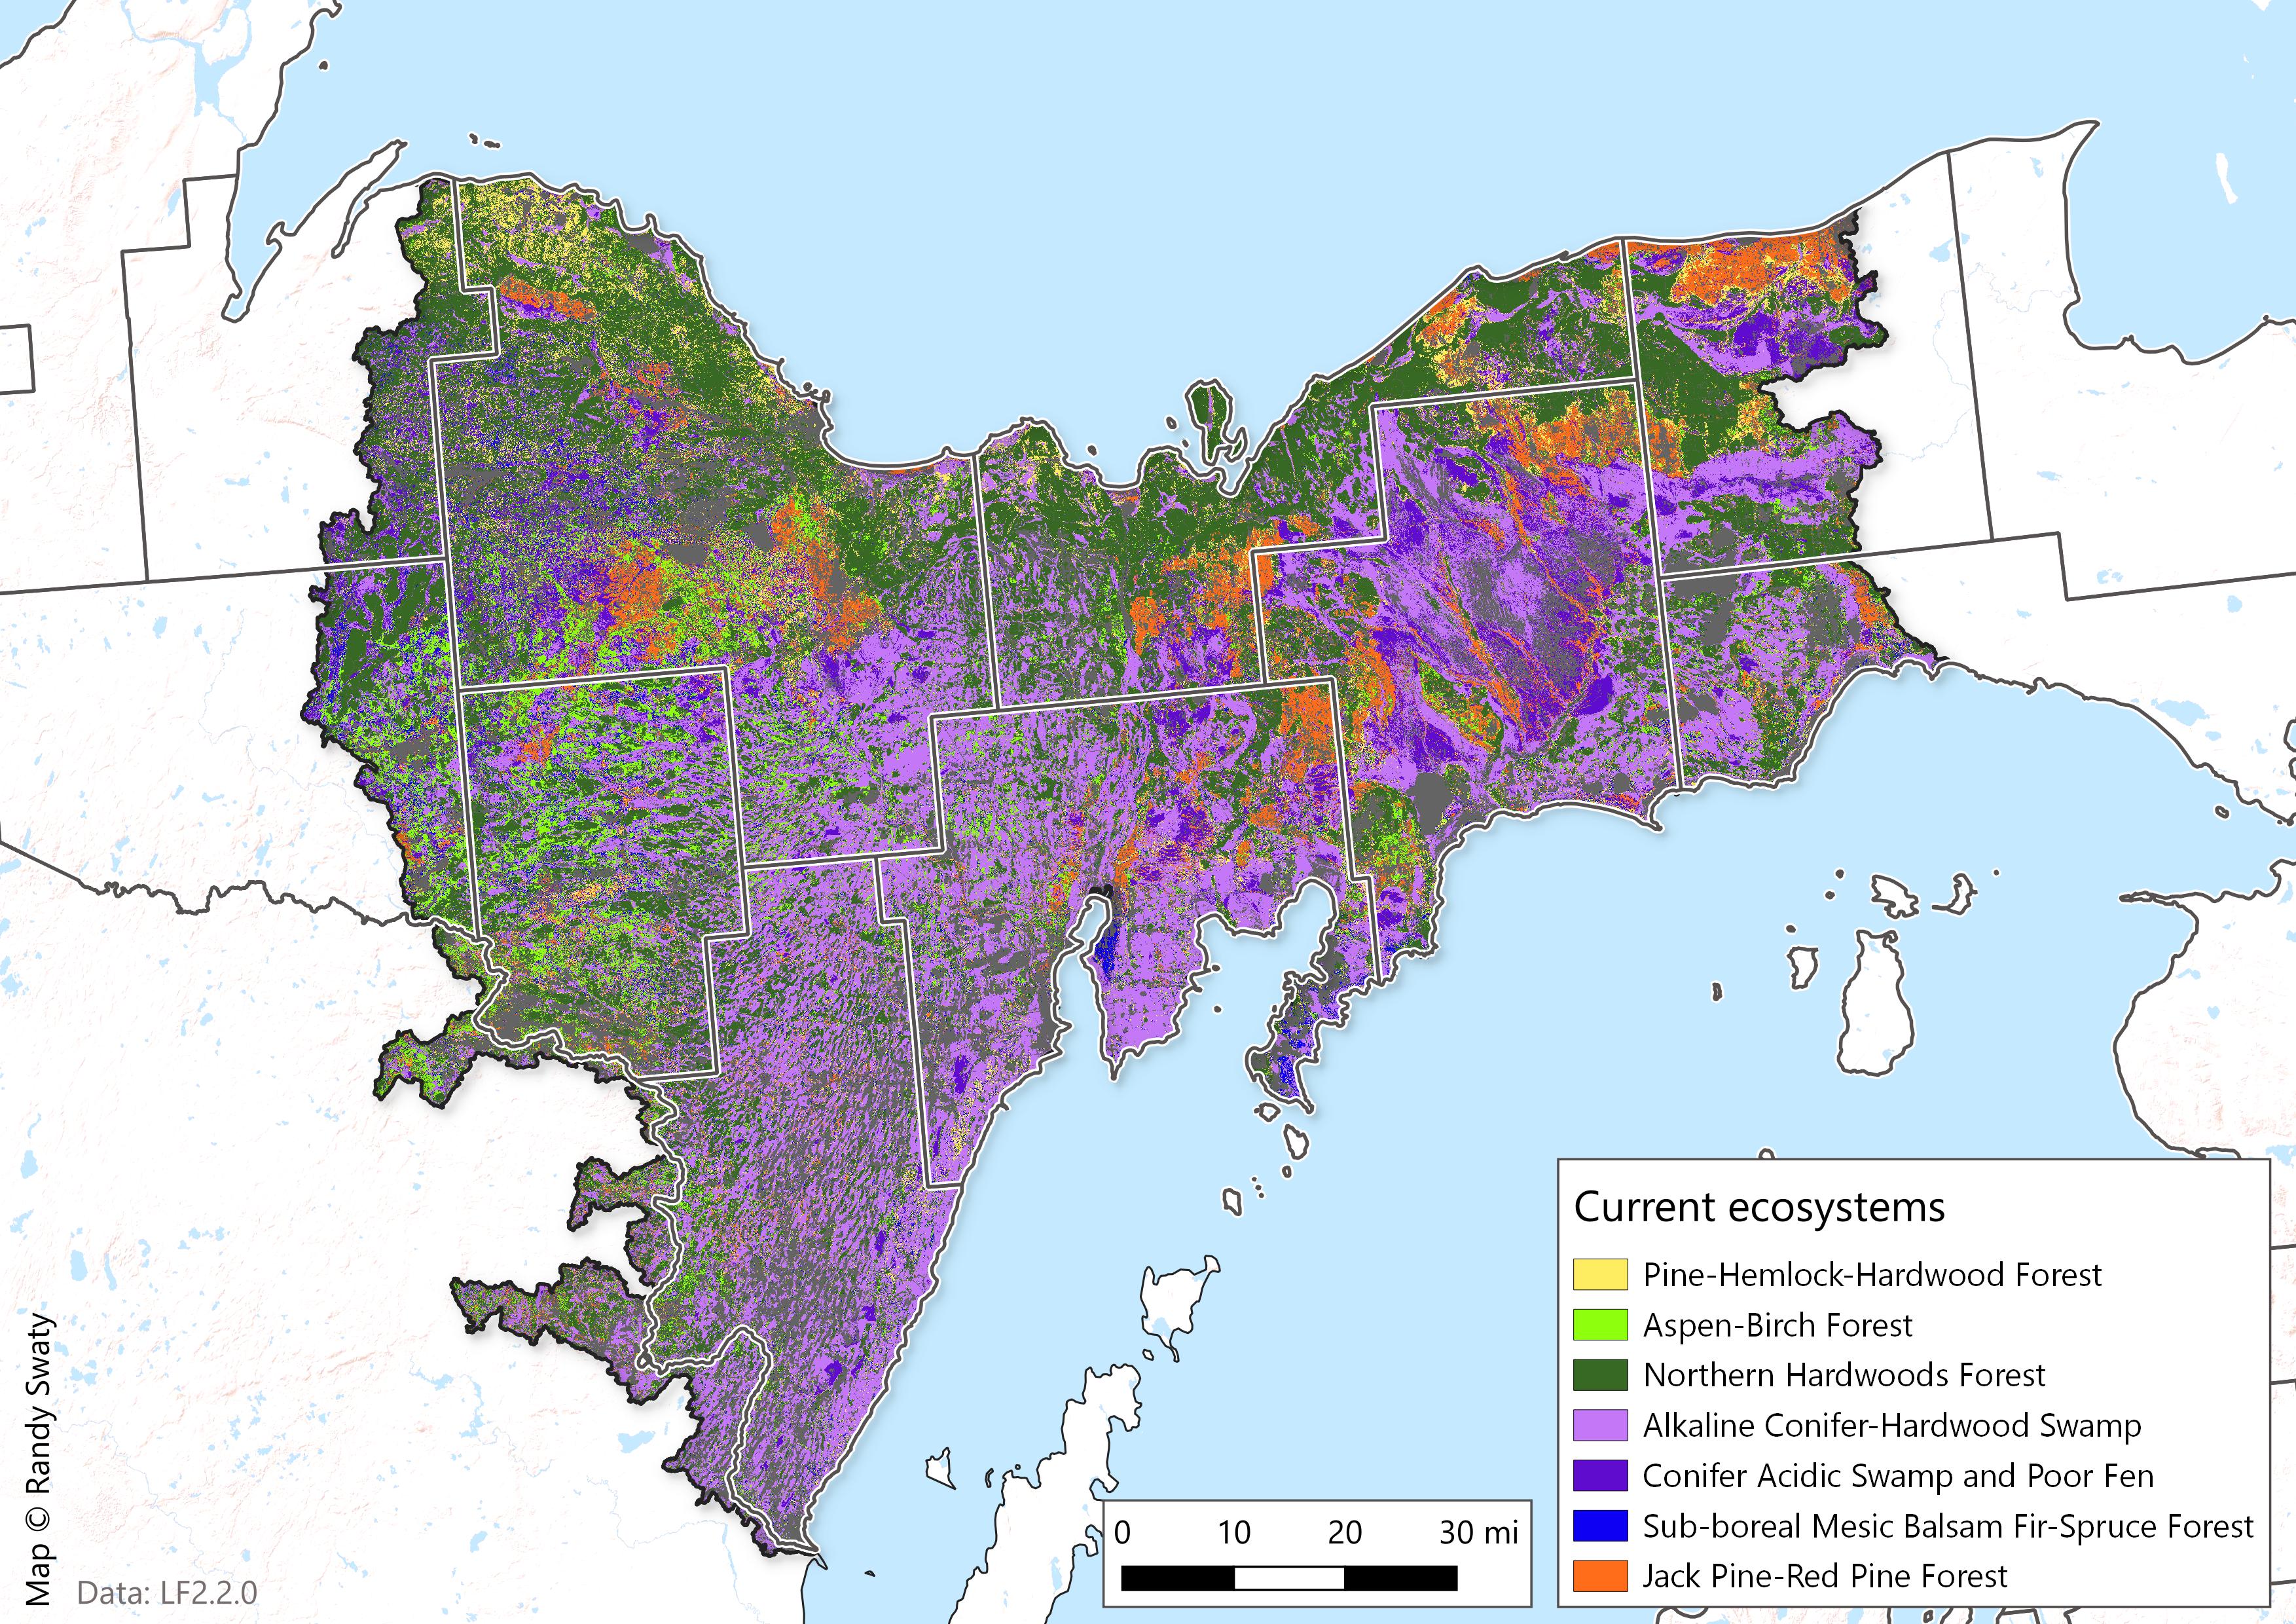
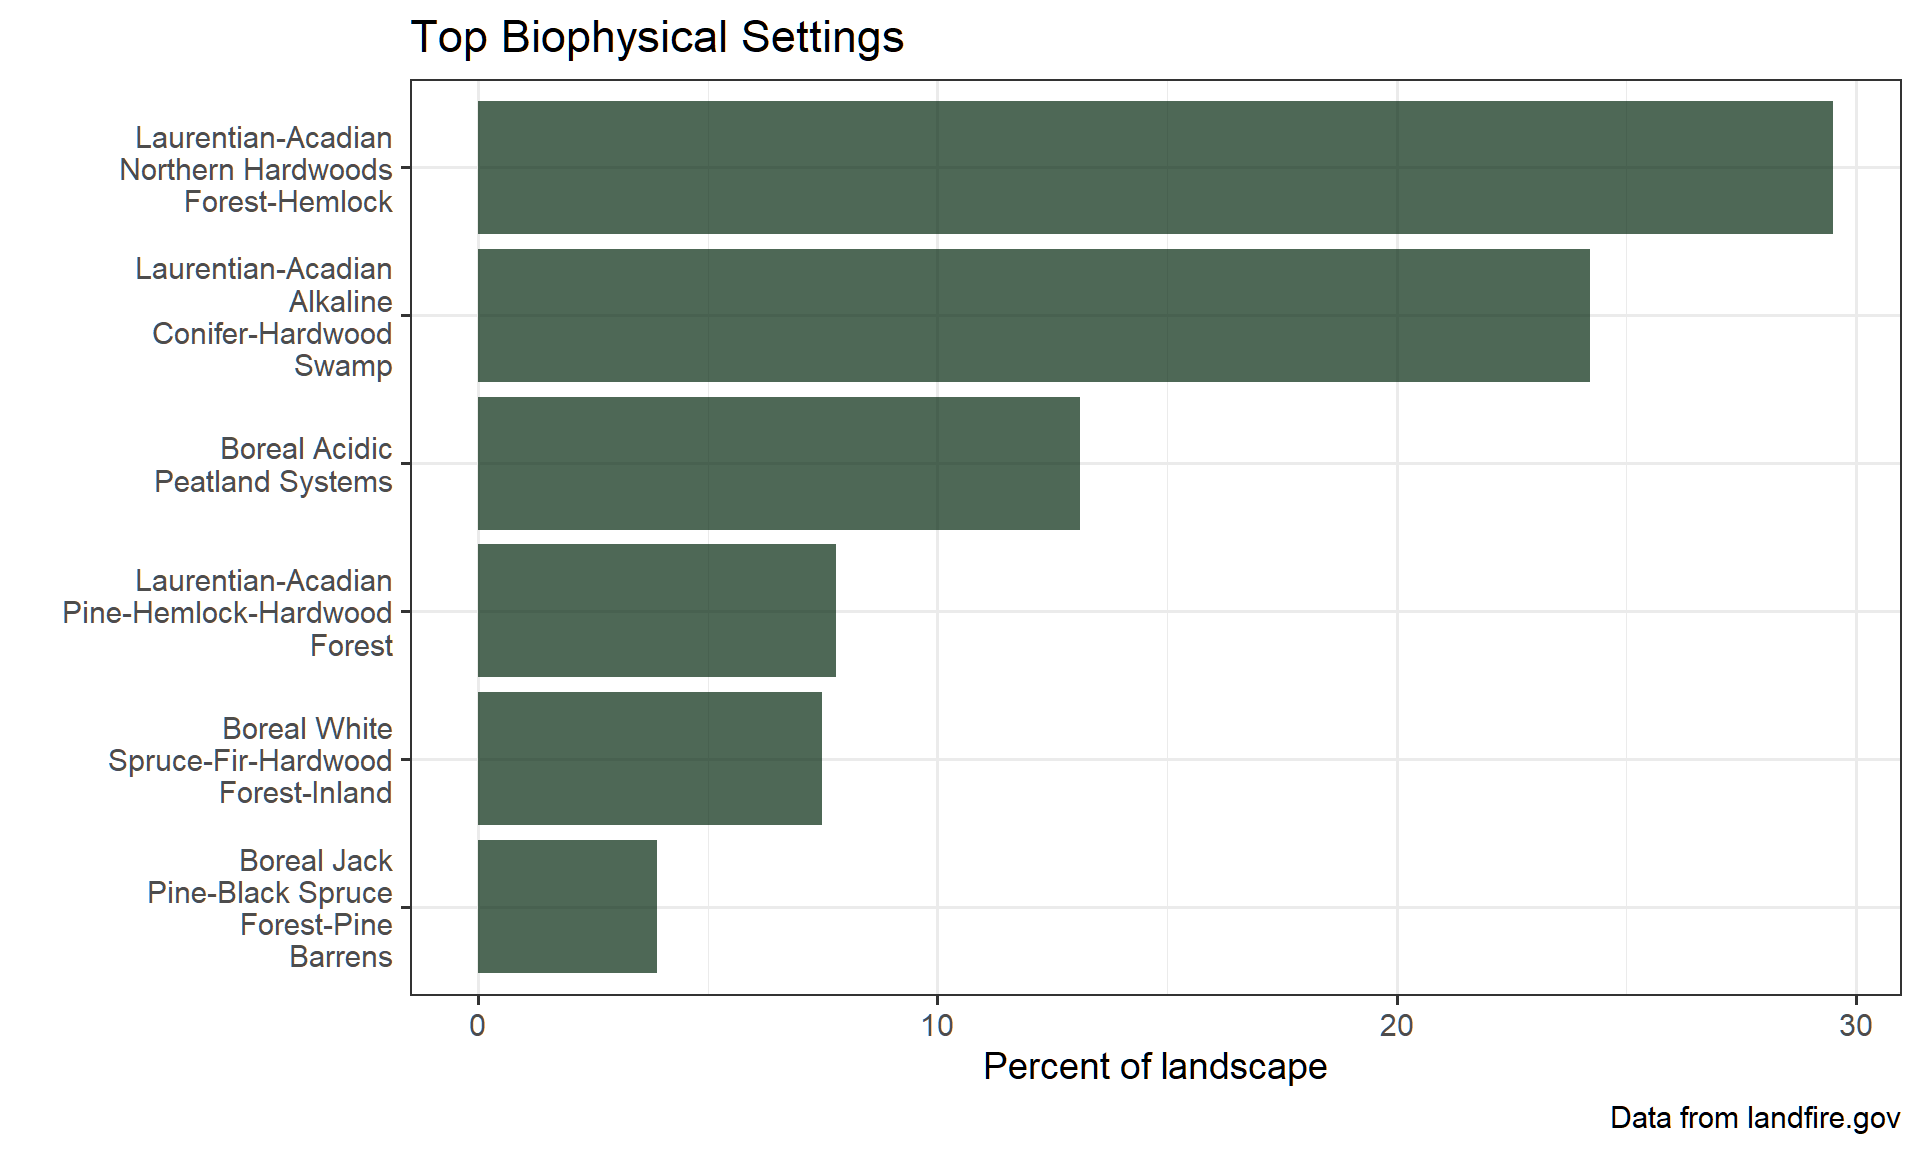
Using LANDFIRE Existing Vegetation Type data, we mapped and quantified patterns of the most dominant ecosystems in the central Upper Peninsula as of 2022. For clarity most dominant ecosystems were mapped (ones that covered more than 5% of the landscape). Lists and quantities of all ecosystems are available by contacting Randy Swaty (rswaty@tnc.org).
We found:
- Almost all of the area is naturally vegetated, with ~ 5% classified as ‘Agricultural’ and ~2% classified as ‘Developed’.
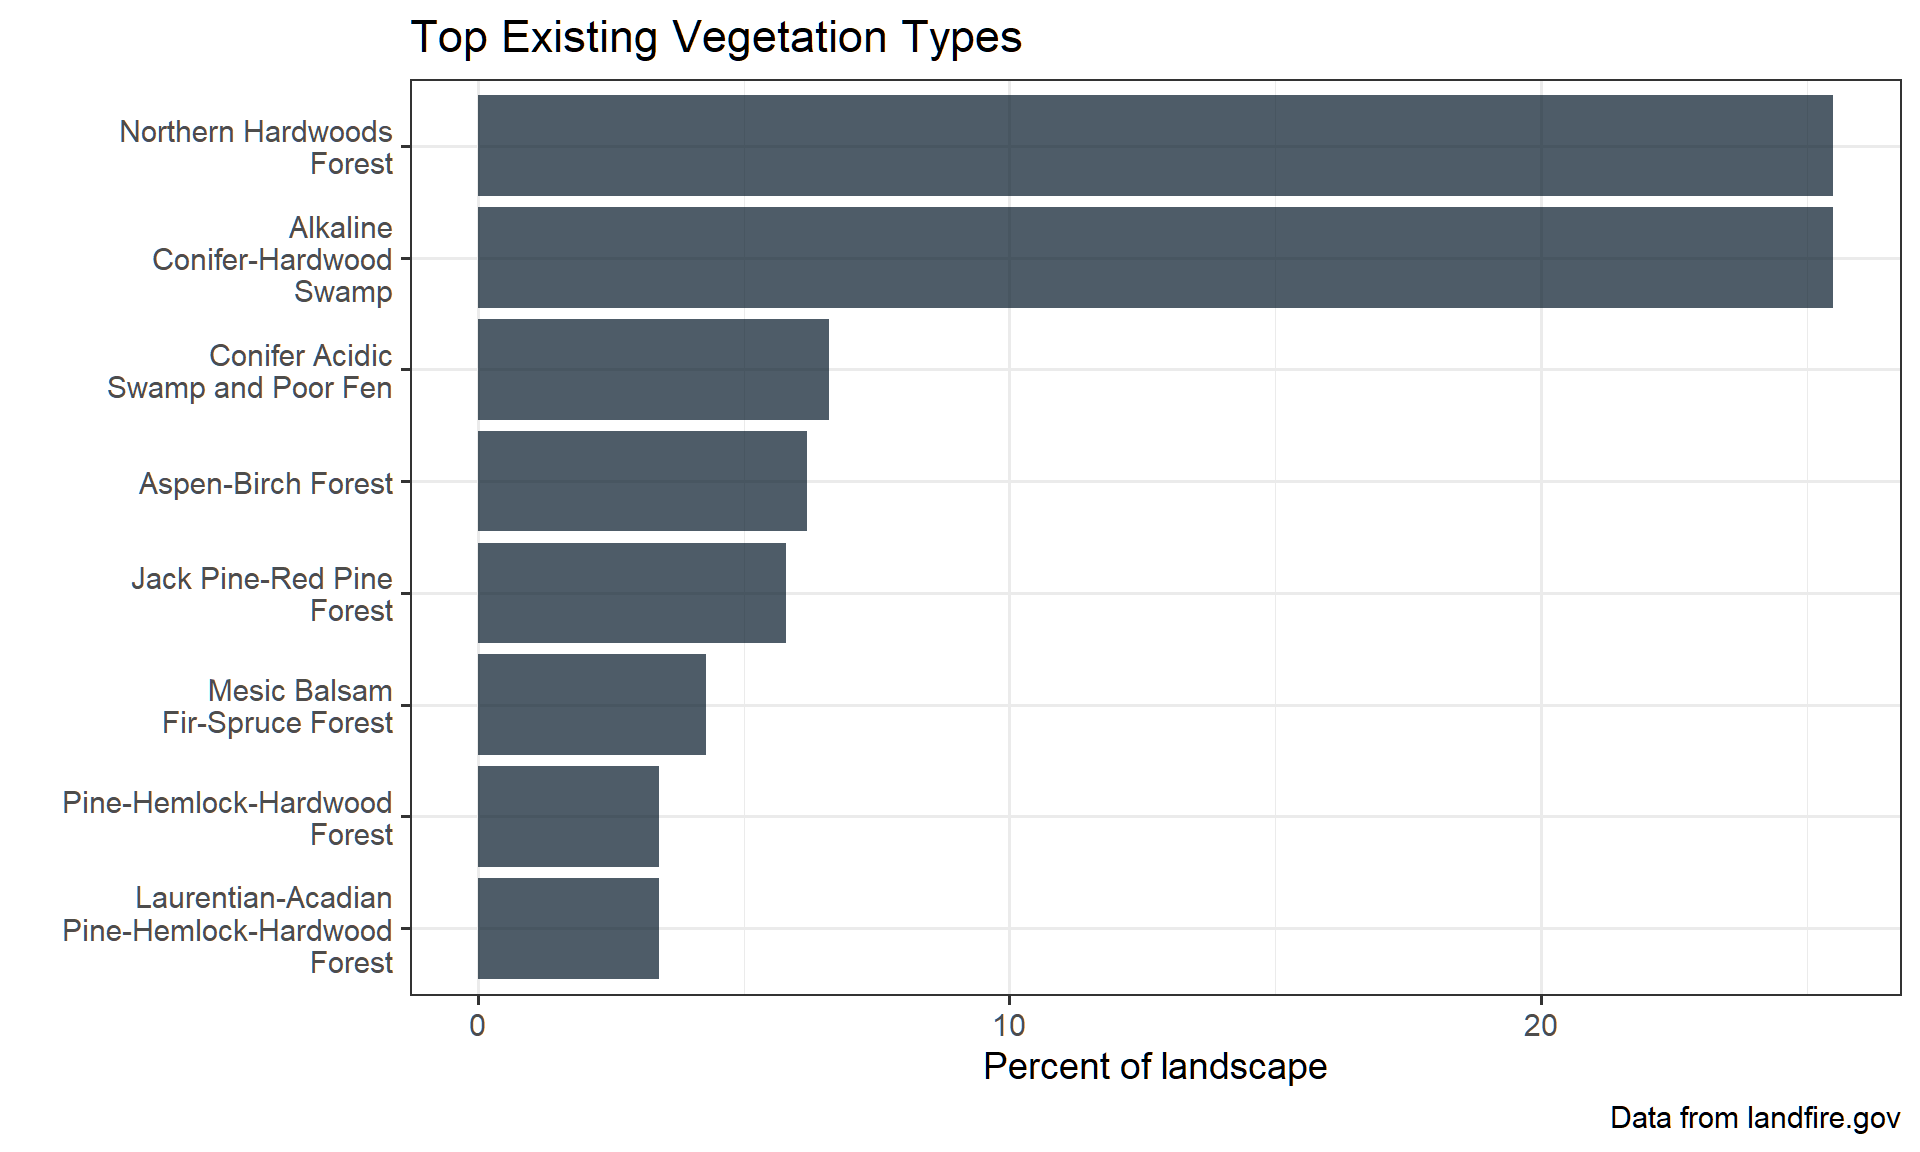
- Just over 1/4 of the CUP is classified as Northern Hardwoods Forest, and 1/4 as Alkaline Conifer-Hardwood Swamp.
- In total, ~37% is typed as various ‘riparian’ ecosystems.
- Broadly, the northern hardwoods forests are located more in the northern part of the region, with wetland/riparian types in the mid and southern parts. Jack pine-red pine types are scattered throughout.
Map of current ecosystems
Bar chart of current ecosystems
To learn more about the dataset, go to https://landfire.gov/evt.php. To explore descriptions of these types, vist the Terrestrial Ecological Systems documentaton by NatureServe and/or the hyperlinks above.
Use caution when comparing the Current and Historical ecosystem maps. The input datasets and methods are not directly comparable.
Historical ecosystems
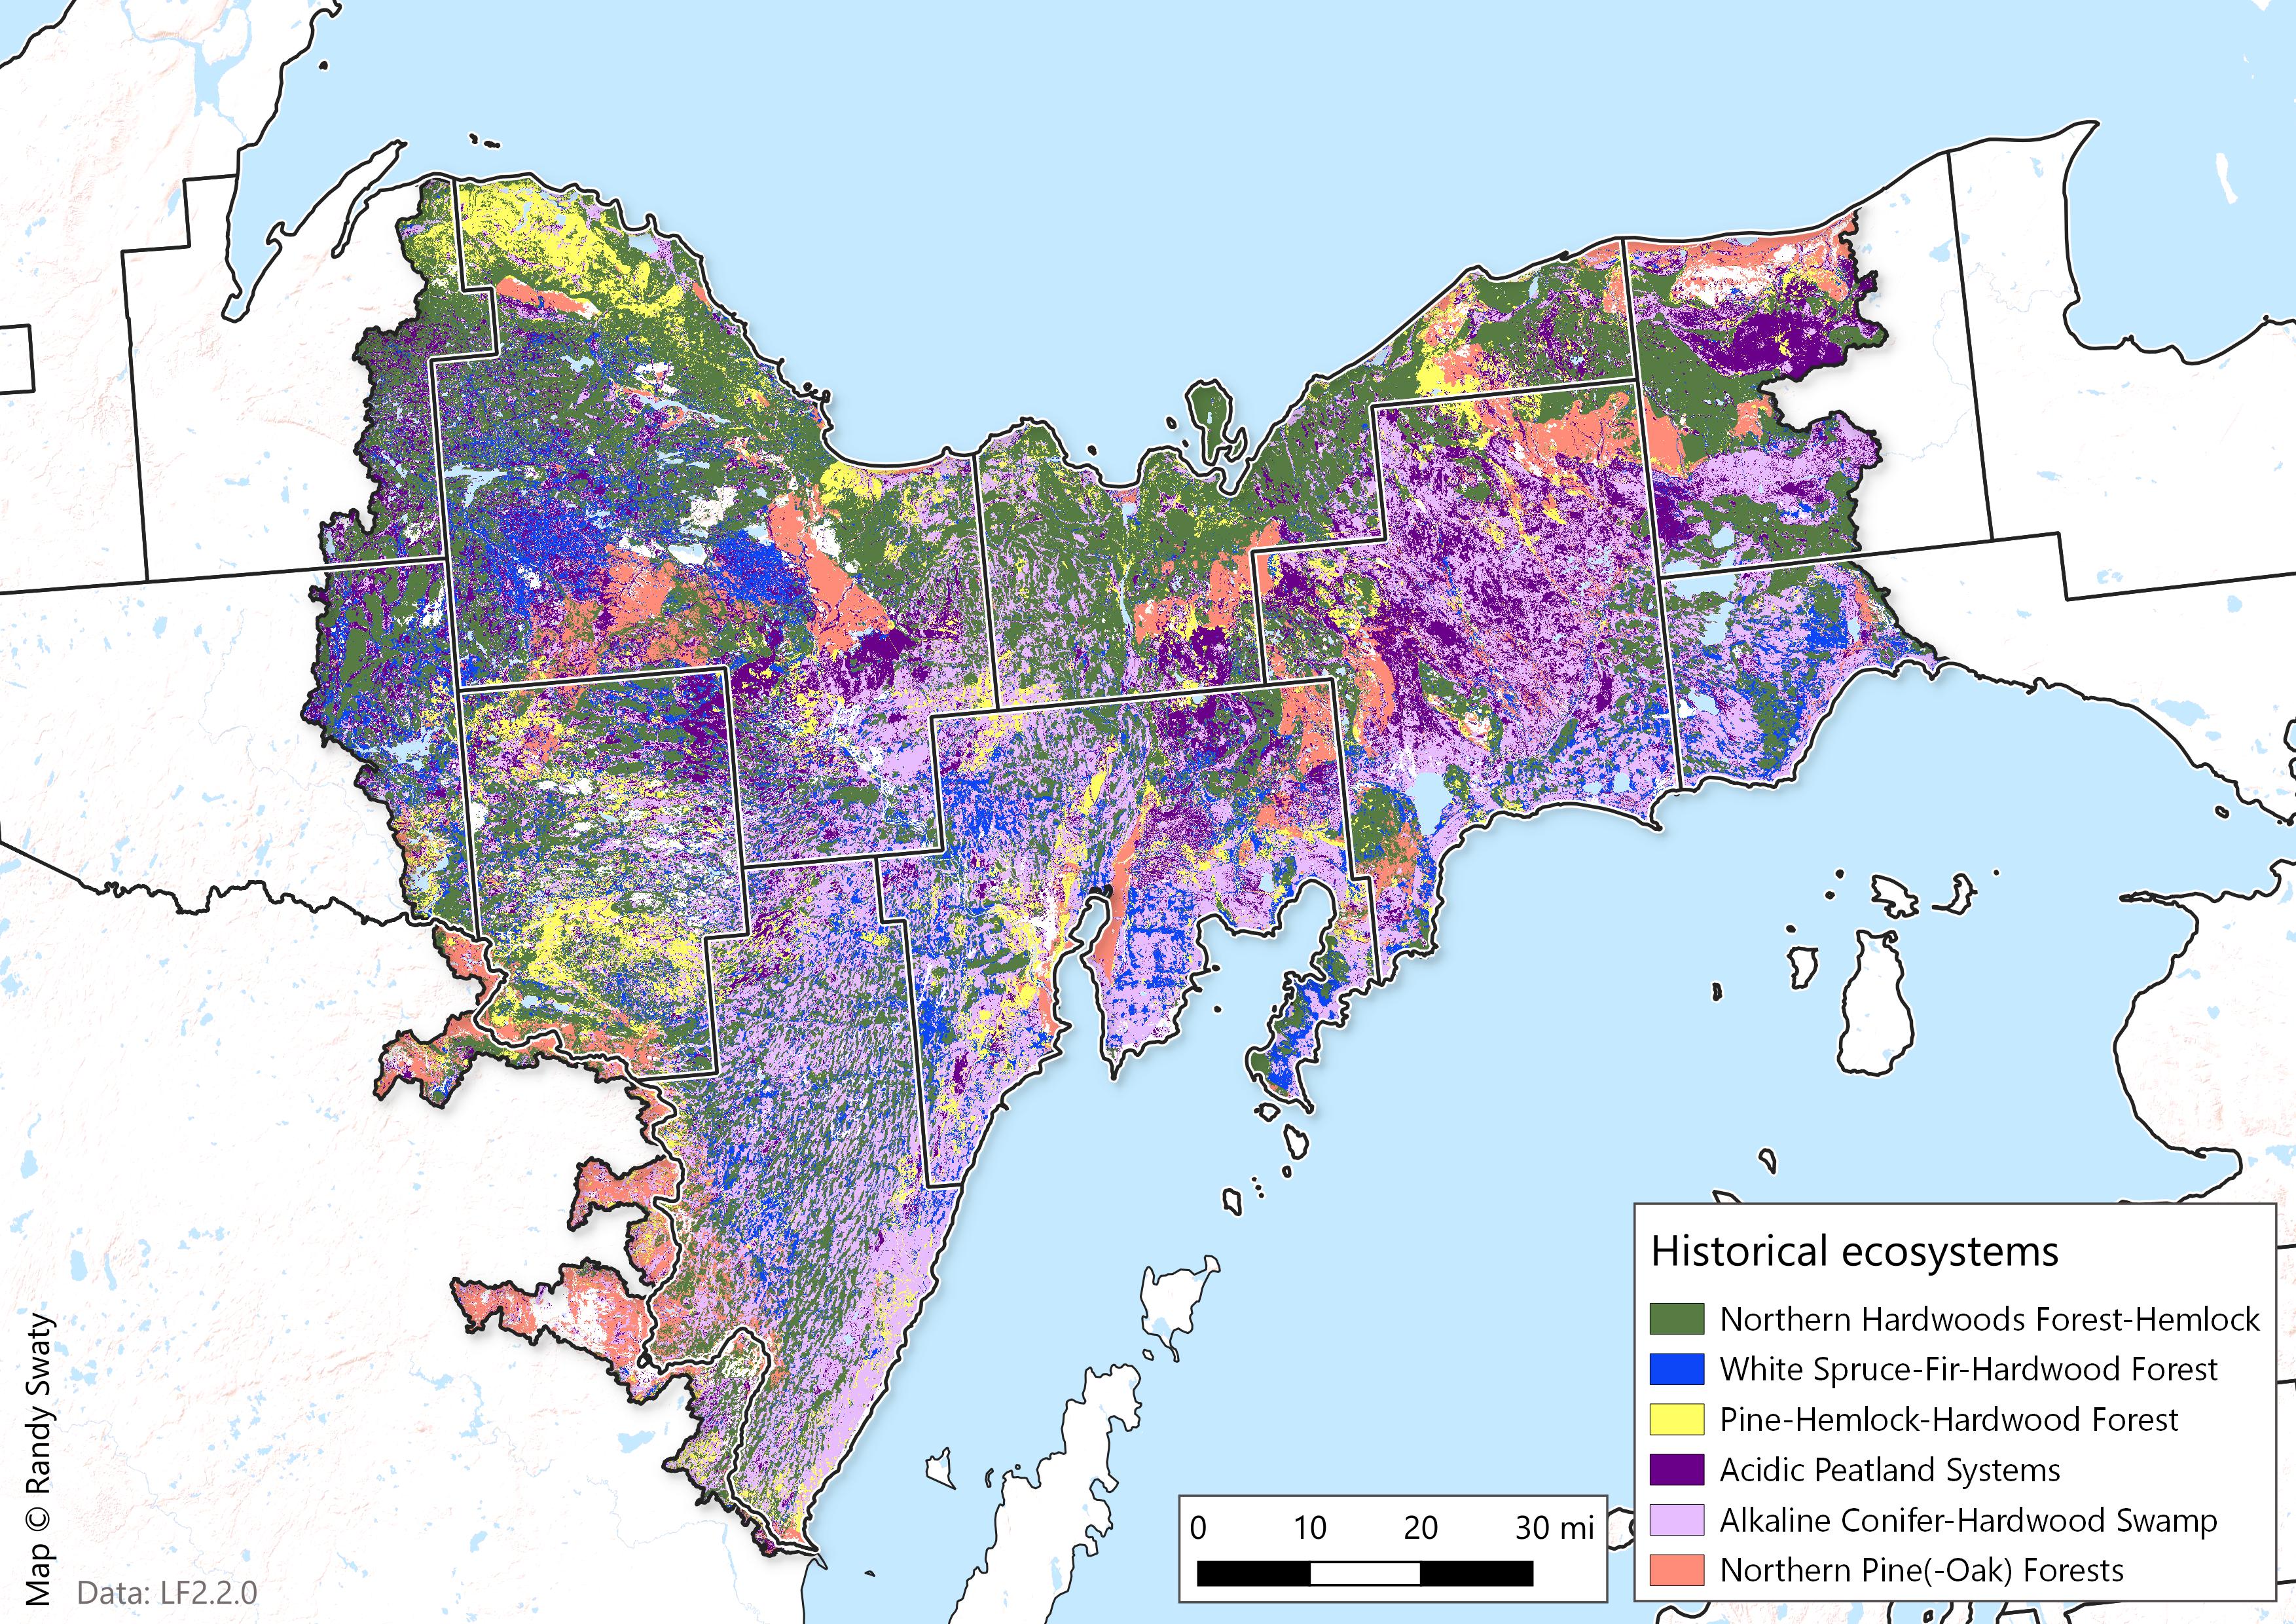
Using a historical ecosystems dataset from LANDFIRE we explored how the central Upper Peninsula looked prior to European Colonization.
We found:
- There have not been substantial changes in general, i.e., the area was dominated by riparian and northern hardwood types historically.
- The ‘Aspen-Birch’ type that is mapped on the current landscape may have also occurred historically, but may have been a ‘developmental stage’ within an ecosystem. LANDFIRE data does not allow for direct exploration of this type.
Map of historical ecosystems
Bar chart of historical ecosystems
Historical information presented for context. It does not necessarily equal a ‘Desired Future Condition’, and should be compared with current situation for trend exploration only.
To learn about the dataset, visit https://landfire.gov/vegetation/bps , and to explore specific types, including descriptions, go to https://landfirereview.org/search.php.
For the so-inclined: other ways to explore change
As noted above, making comparisons between the ‘current’ and ‘historical’ ecosystem datasets should only be done to explore trends. We “grouped” ecosystems into broader types for a exploration of past vs. present.
Below are two different ways to visualize the same data, one a circular ‘Chord’ diagram, the second a more linear ‘Sankey’ diagram.
Chord Diagram
In the chord diagram below, you can hover over an outer band (e.g., near the phrase ‘Past Hardwood’ on the right side of the chord diagram) to see how much of a historical area is still mapped as that type, and how much is different.
For example, if you hover over the outer green “Past Hardwood-Conifer” band you will see that roughly half has transitioned to “Hardwood” and a substantial portion has transitioned to “Conifer” in current mapping.
Note: the values you see when you hover over the chart are acres.
Some trends you might notice:
- Some of the ‘past conifer’ has transitioned to ‘hardwoods’.
- The area of interest does not have much ‘Developed’ area mapped.
PAST PRESENT
Sankey Diagram
As noted above this diagram presents the same data as the ‘Chord’ diagram, but in a more linear, left-to-right manner. You can hover over the grey bands and colored rectangles to observe patterns such as those noted above with the chord diagram:
- Historically there were 1.74M acres of Hardwoods in the past; 1.84M acres presently
- There are ~ 241K acres of agricultural lands in the assessment area; most are on lands that were formerly mapped as ‘hardwood’.