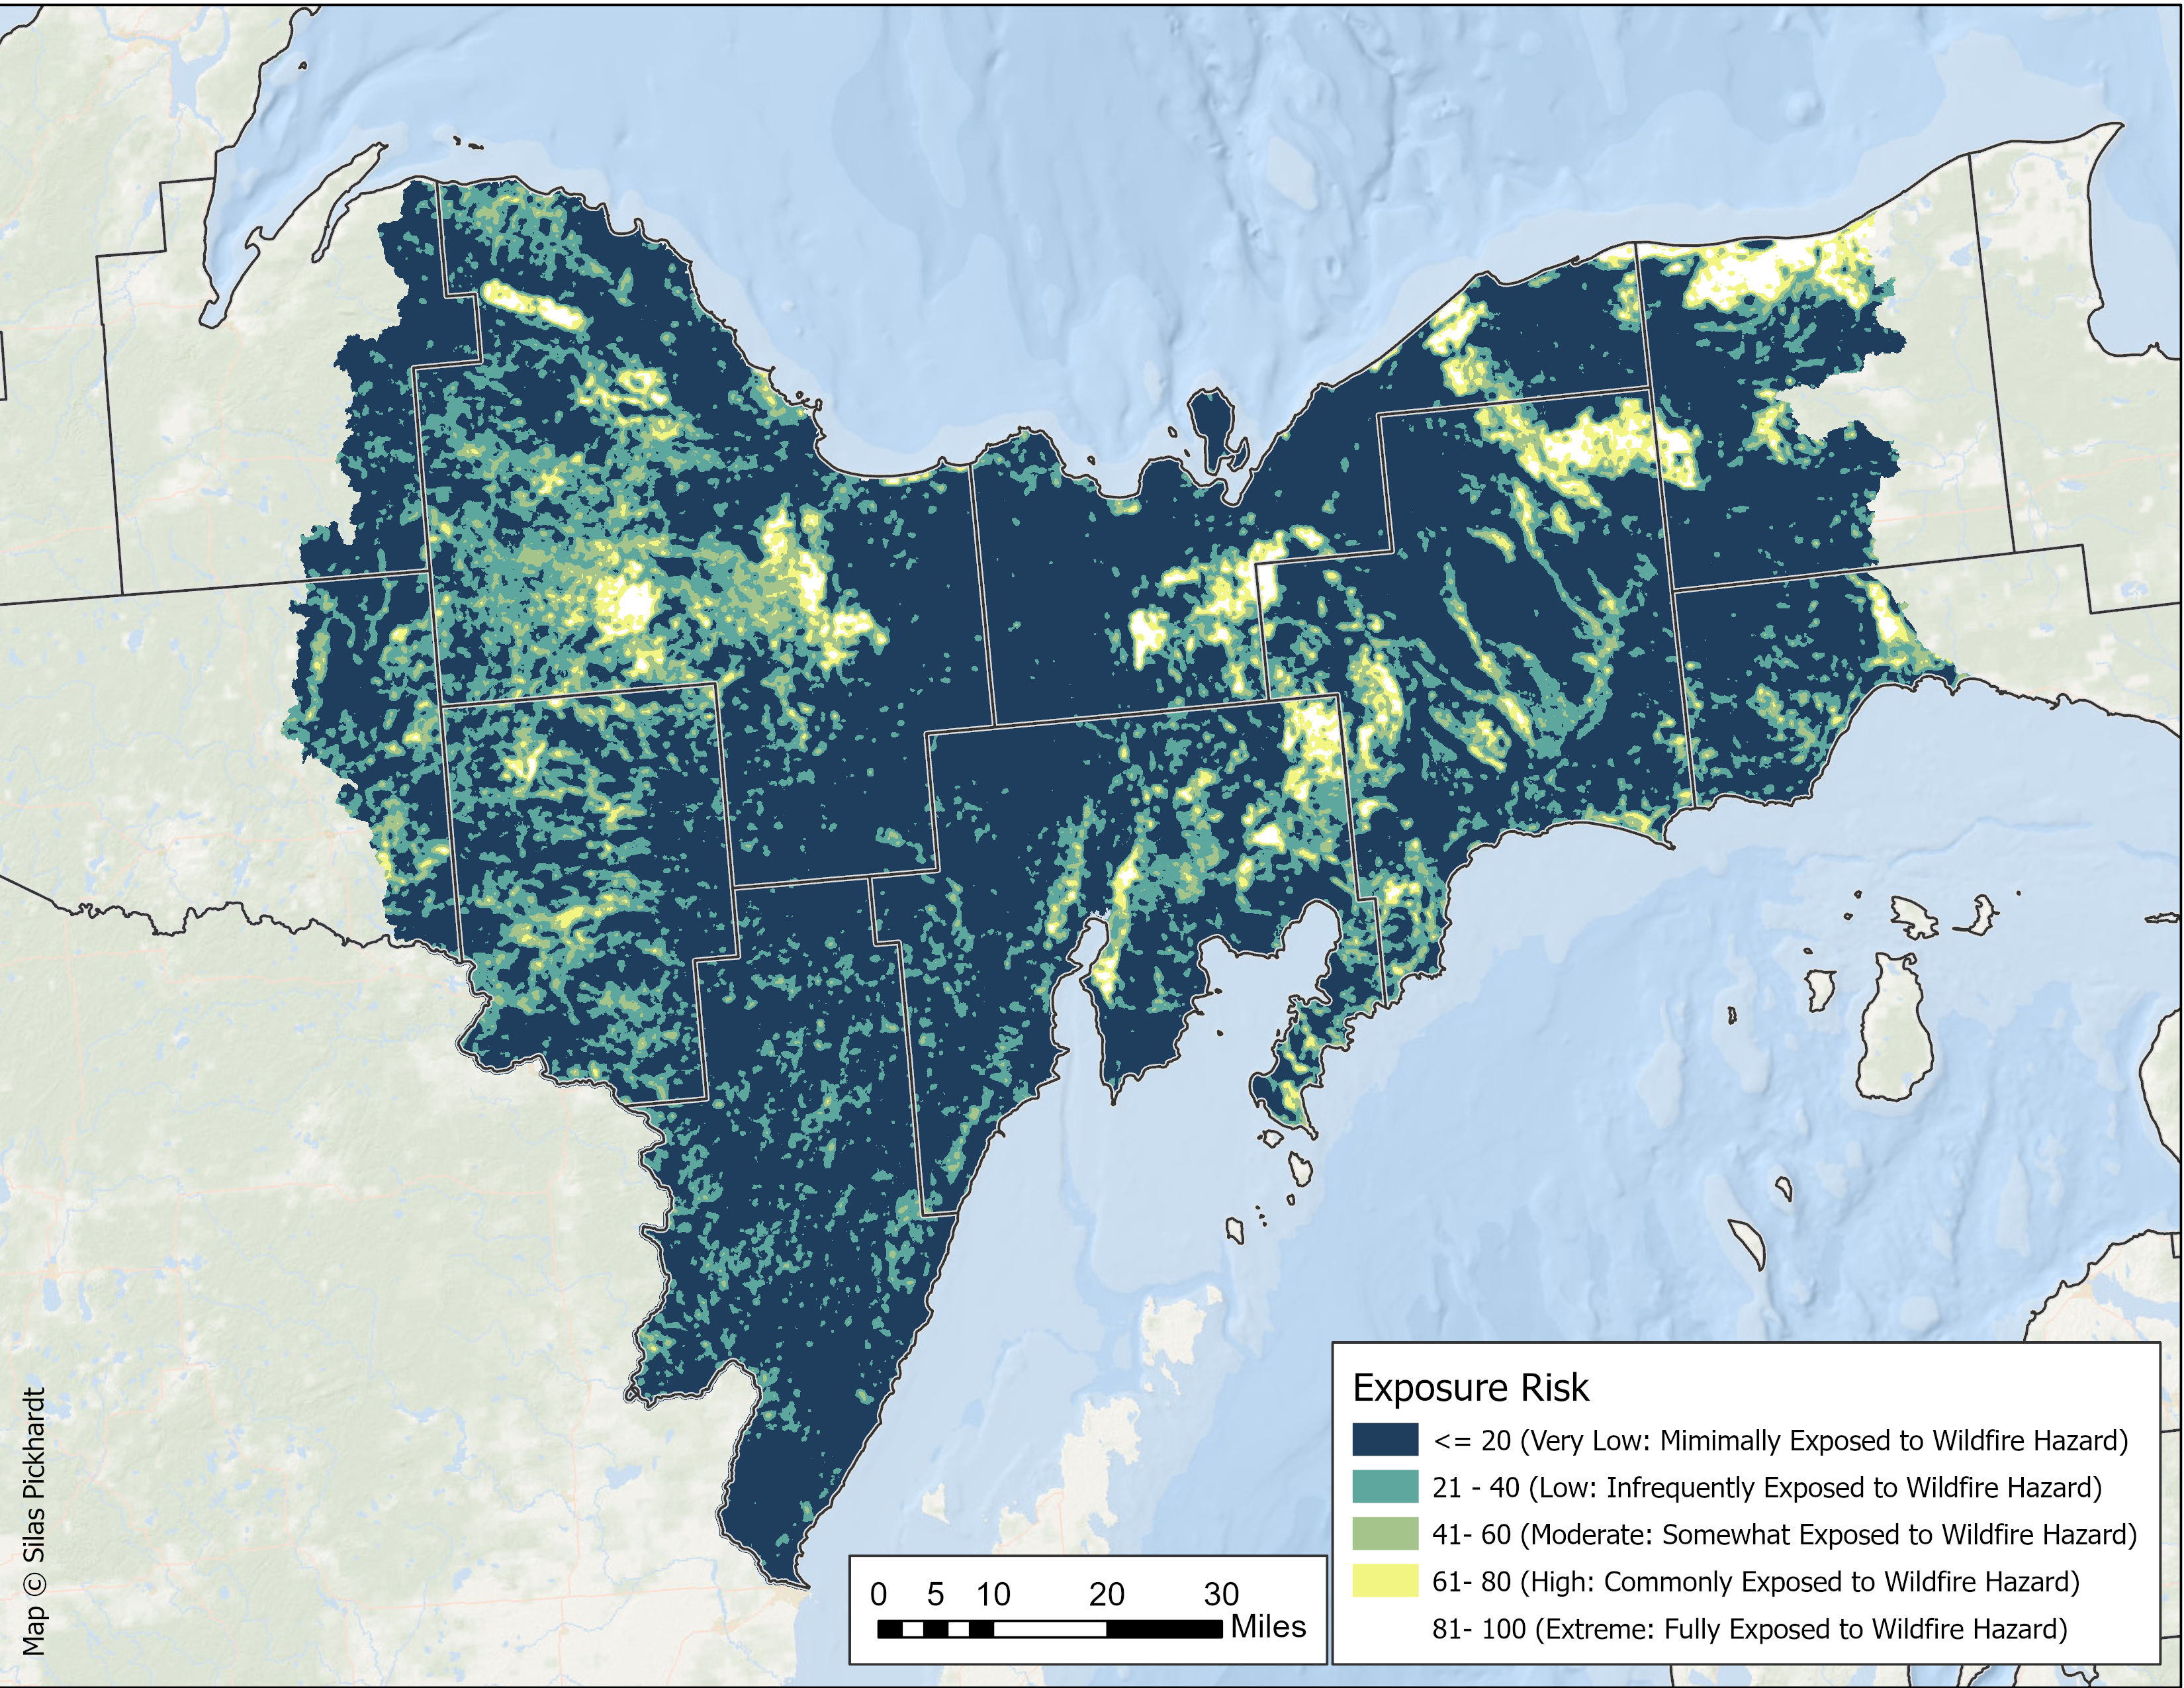
Wildfire Exposure Risk
Wildfire Exposure Risk-Introduction and summary
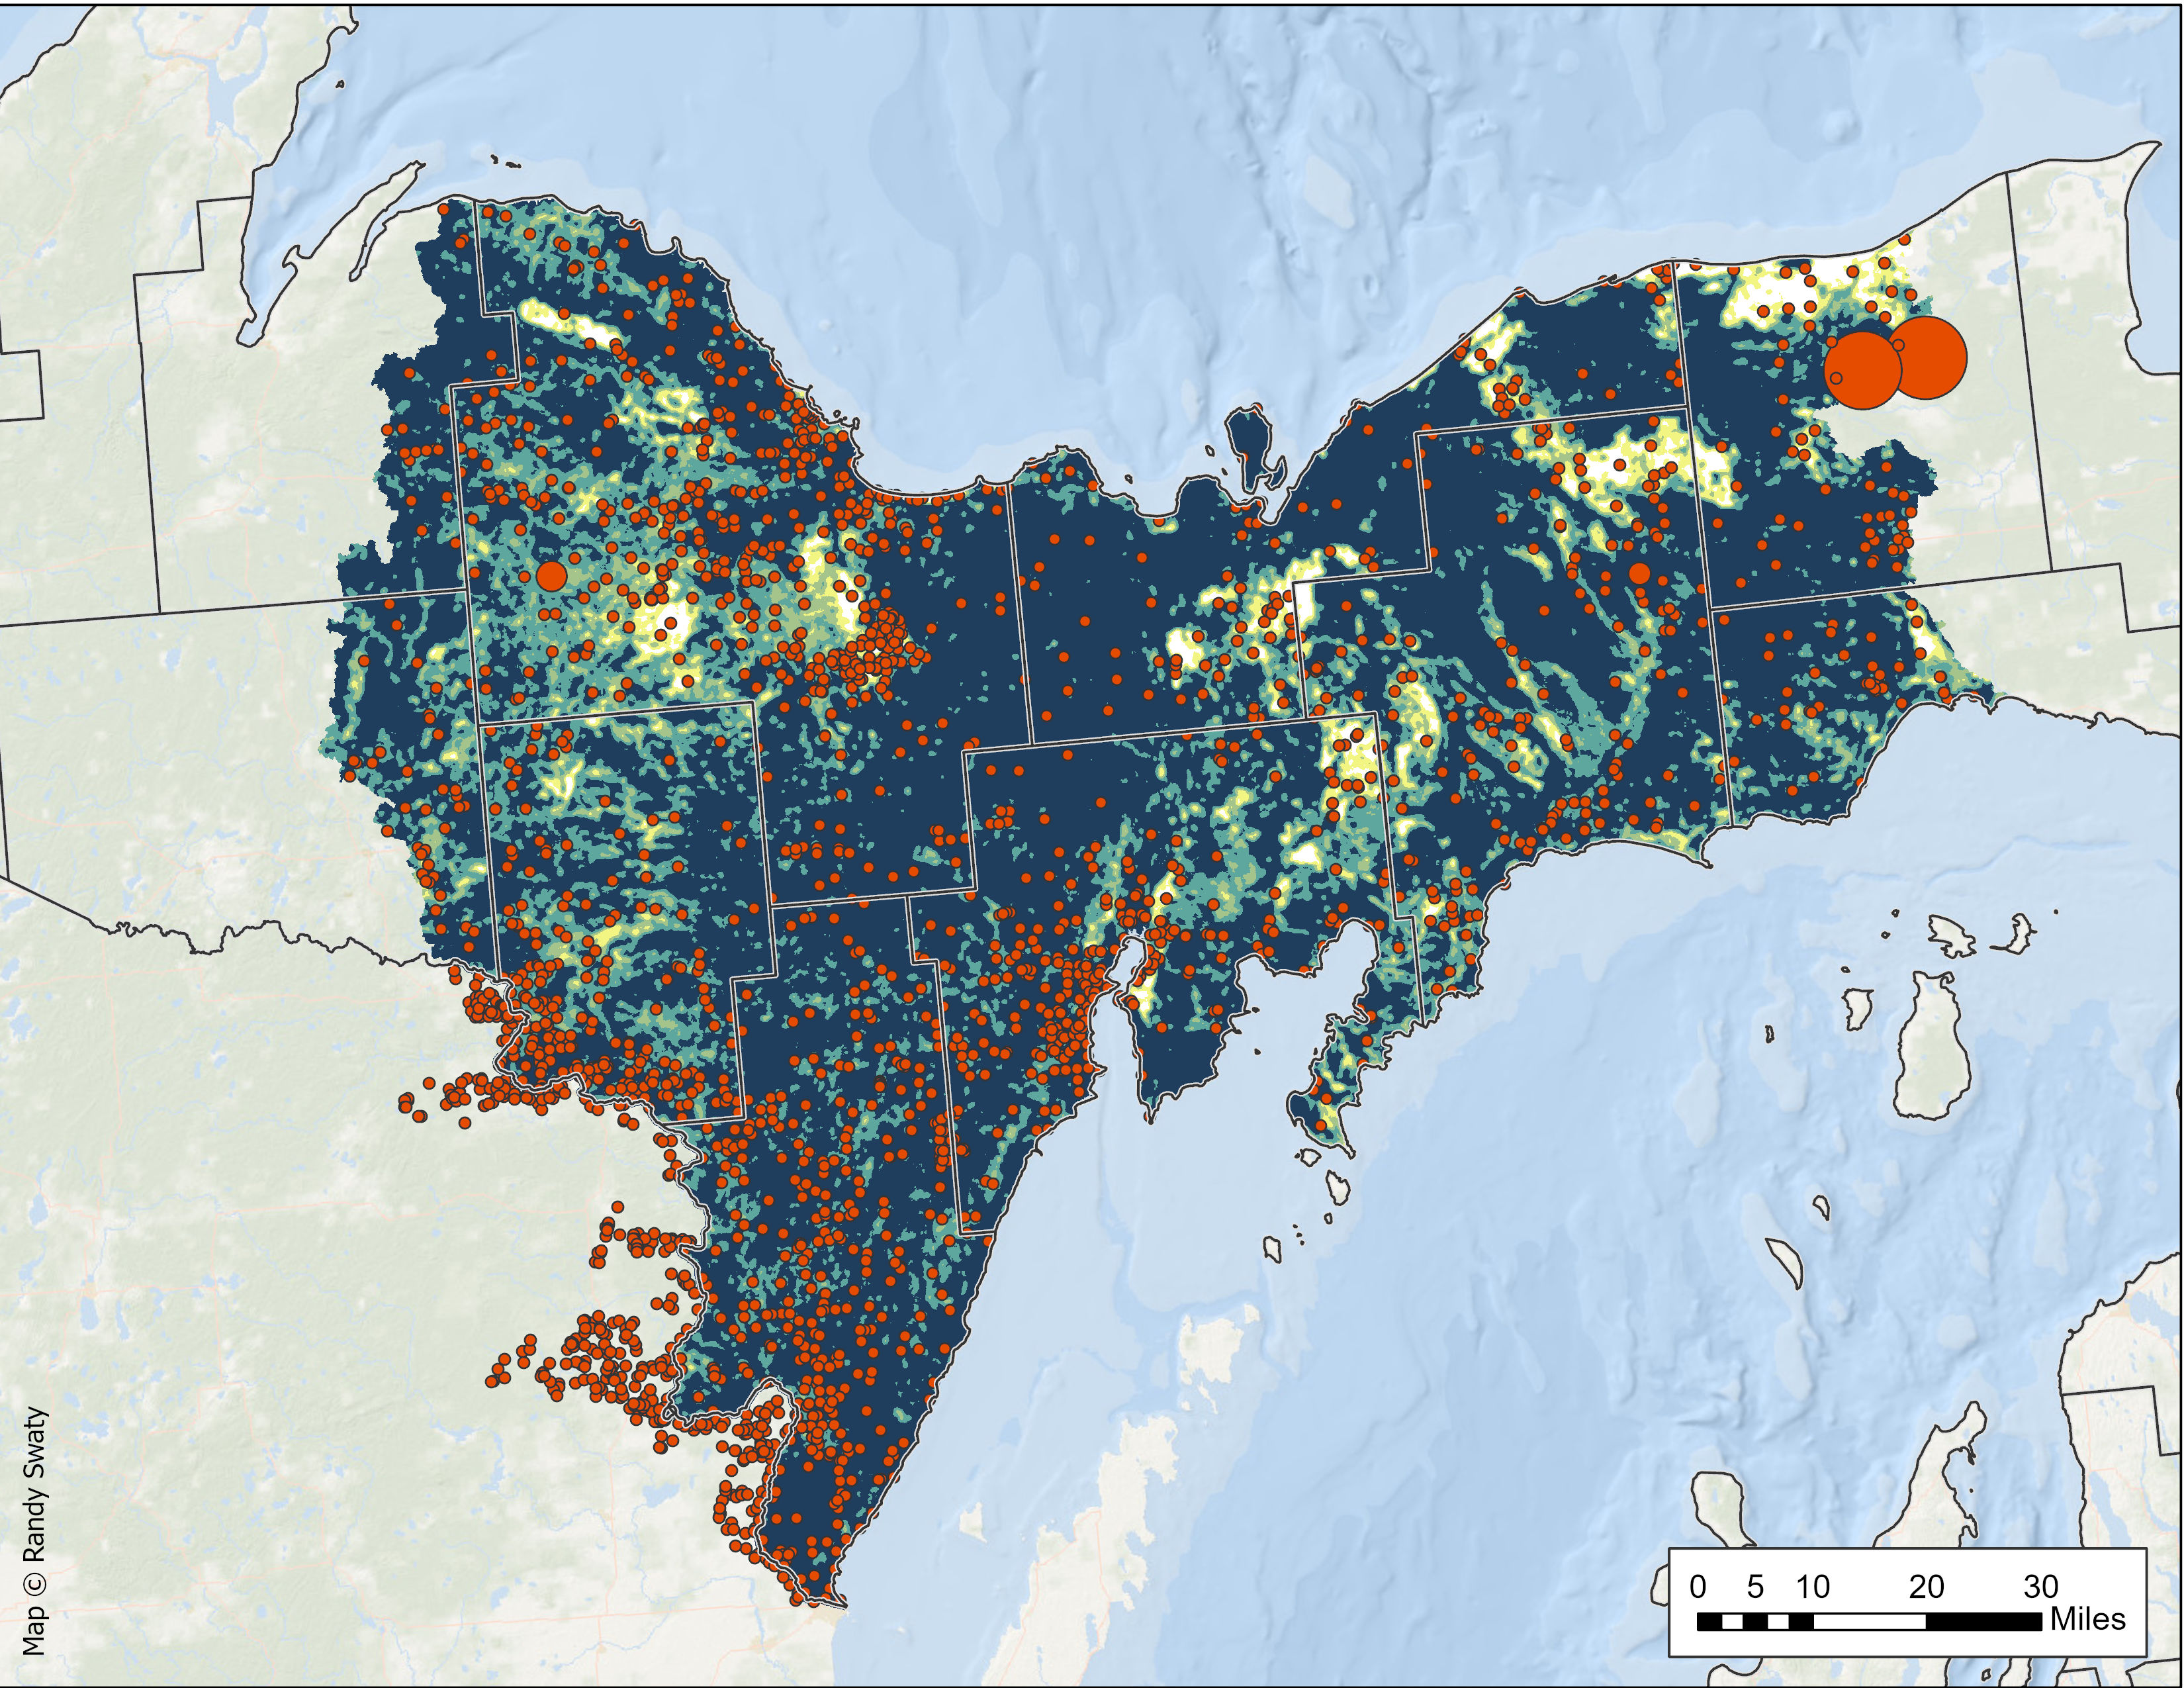
Fire is a natural process that cleans forest floors, allowing more light and nutrients to reach the soil. Ecosystems like red pine-dominated ones naturally undergo frequent surface fires, clearing debris. Without these fires, fuel buildup increases, raising the risk of more hazardous fires. Our map illustrates “Wildfire Exposure Risk,” showing the likelihood of fire spread. It is a complimentary effort to the Marquette County Wildfire Protection Plan.
We found:
- ~ 5% of the assessment area is in the highest 2 categories of Wildfire Exposure Risk.
- The highest risk areas include:
- A region stretching NNE from Little Lake, MI to Cascade, MI (near Goose Lake).
- South of Ishpeming, MI, in and around Black River Falls.
- Several areas in the eastern portion of the assessment, such as SE of Pictured Rocks NL, the Two-Hearted River watershed (e.g., the Duck Lake Fire) and the Raco Plains.
- Most of the area is in the lowest Wildfire Hazard Exposure Risk category (~67%).
Additionally, we present two other datasets in addition to our calculations of Wildfire Exposure Risk, both of which largely corroborate our findings.
Map of Wildfire Exposure Risk
This map was created by assigning ‘fire spotting probabilities’ to the various current ecosystems of the area as mapped in the LANDFIRE Existing Vegetation Type dataset following methods of Beverly et al., 2021(detailed methods located here). After those assignments were made, we ‘blended’ the values for each particular spot with the surrounding area to better represent potential transmission of fire.
Bar chart of Wildfire Exposure Risk
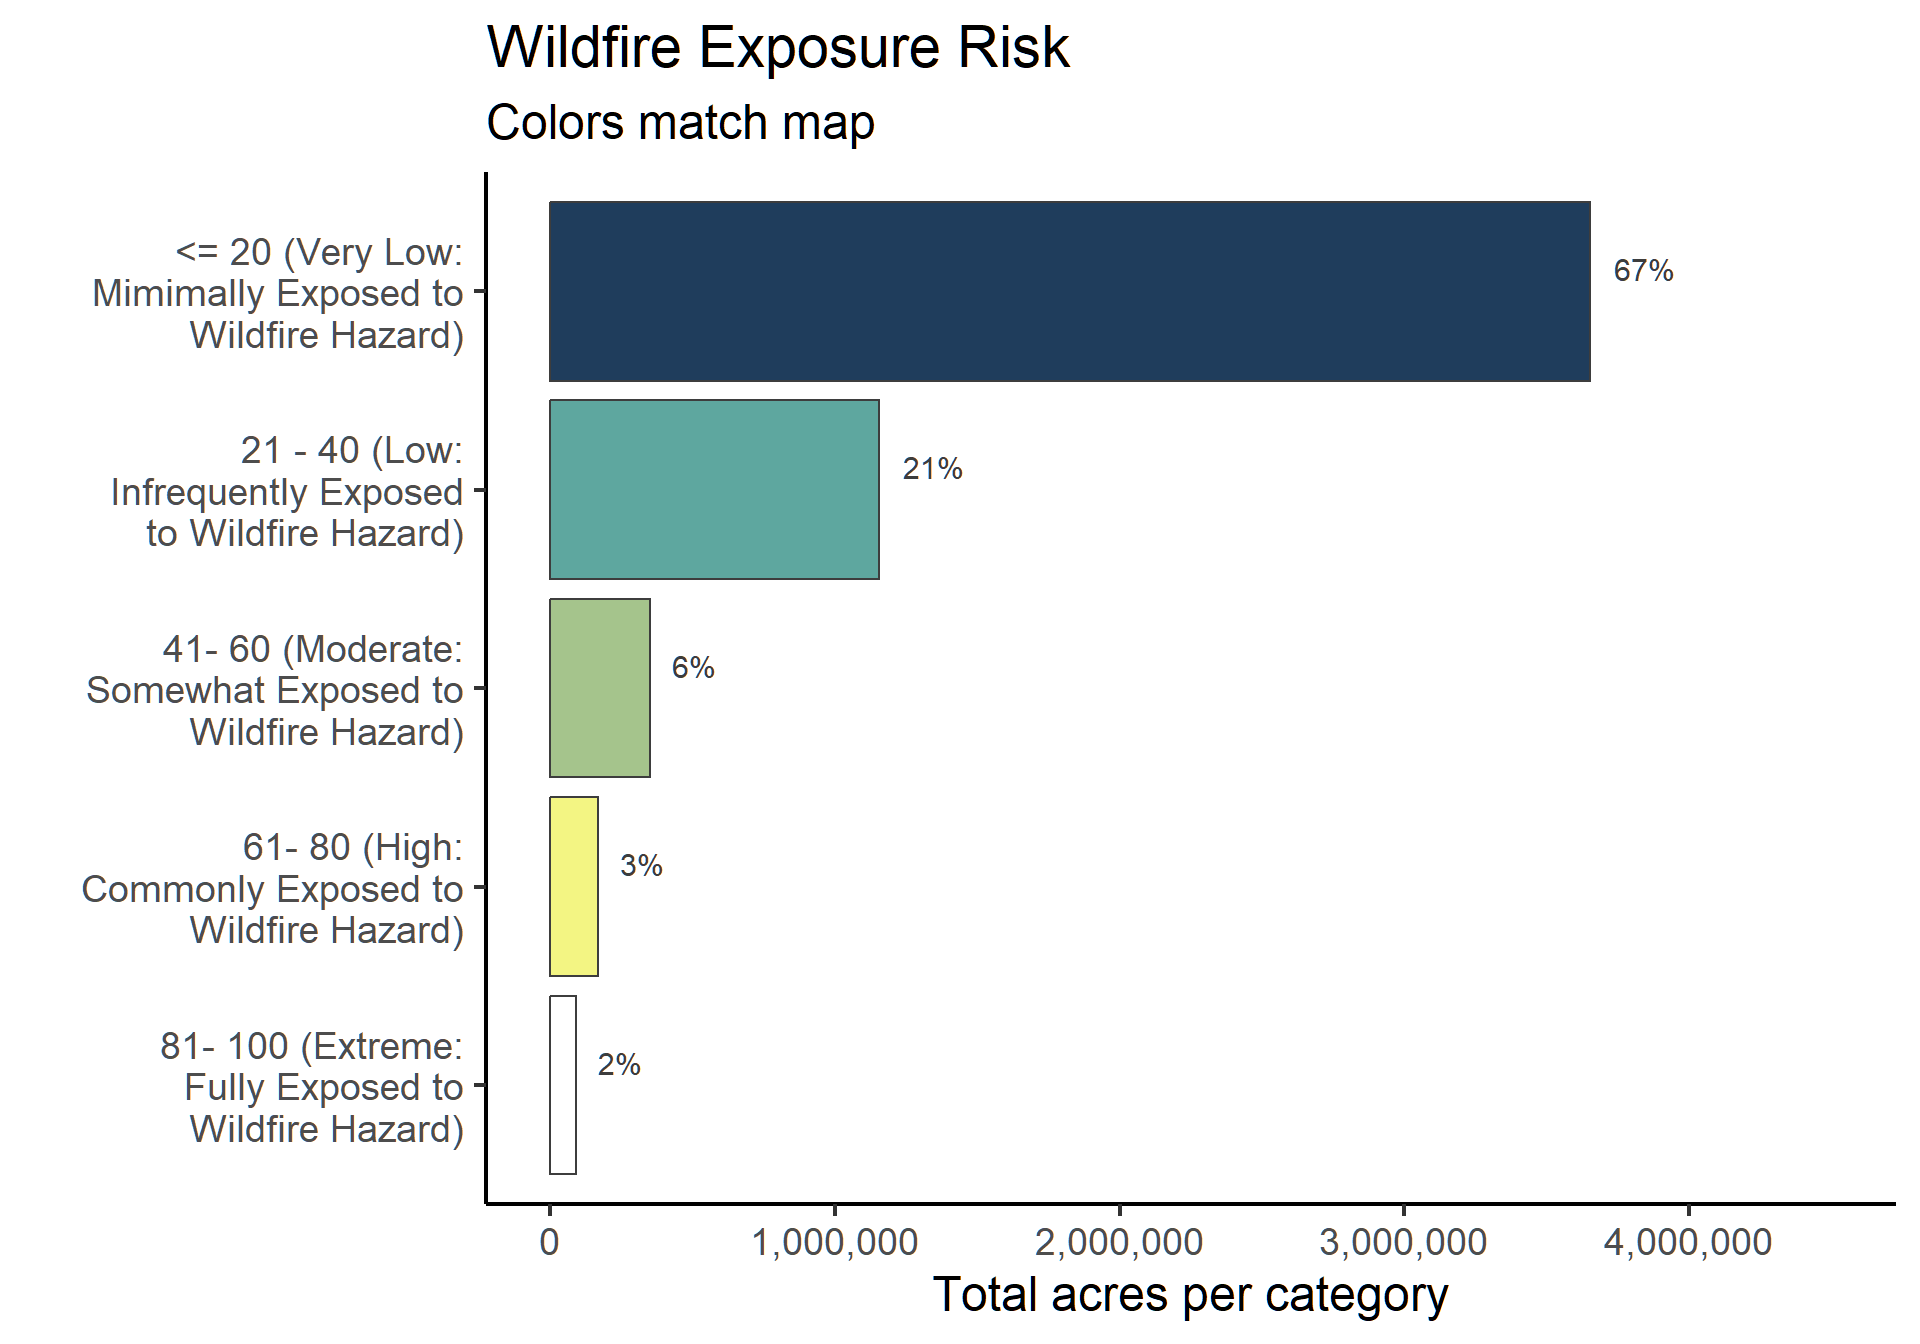
Note: While the chart suggests that the distribution of landscape wildfire potential in our area may be generally low, the local responsibilities for management and protection can still be significant even on relatively small portions of the landscape (Ziel, personal comment).
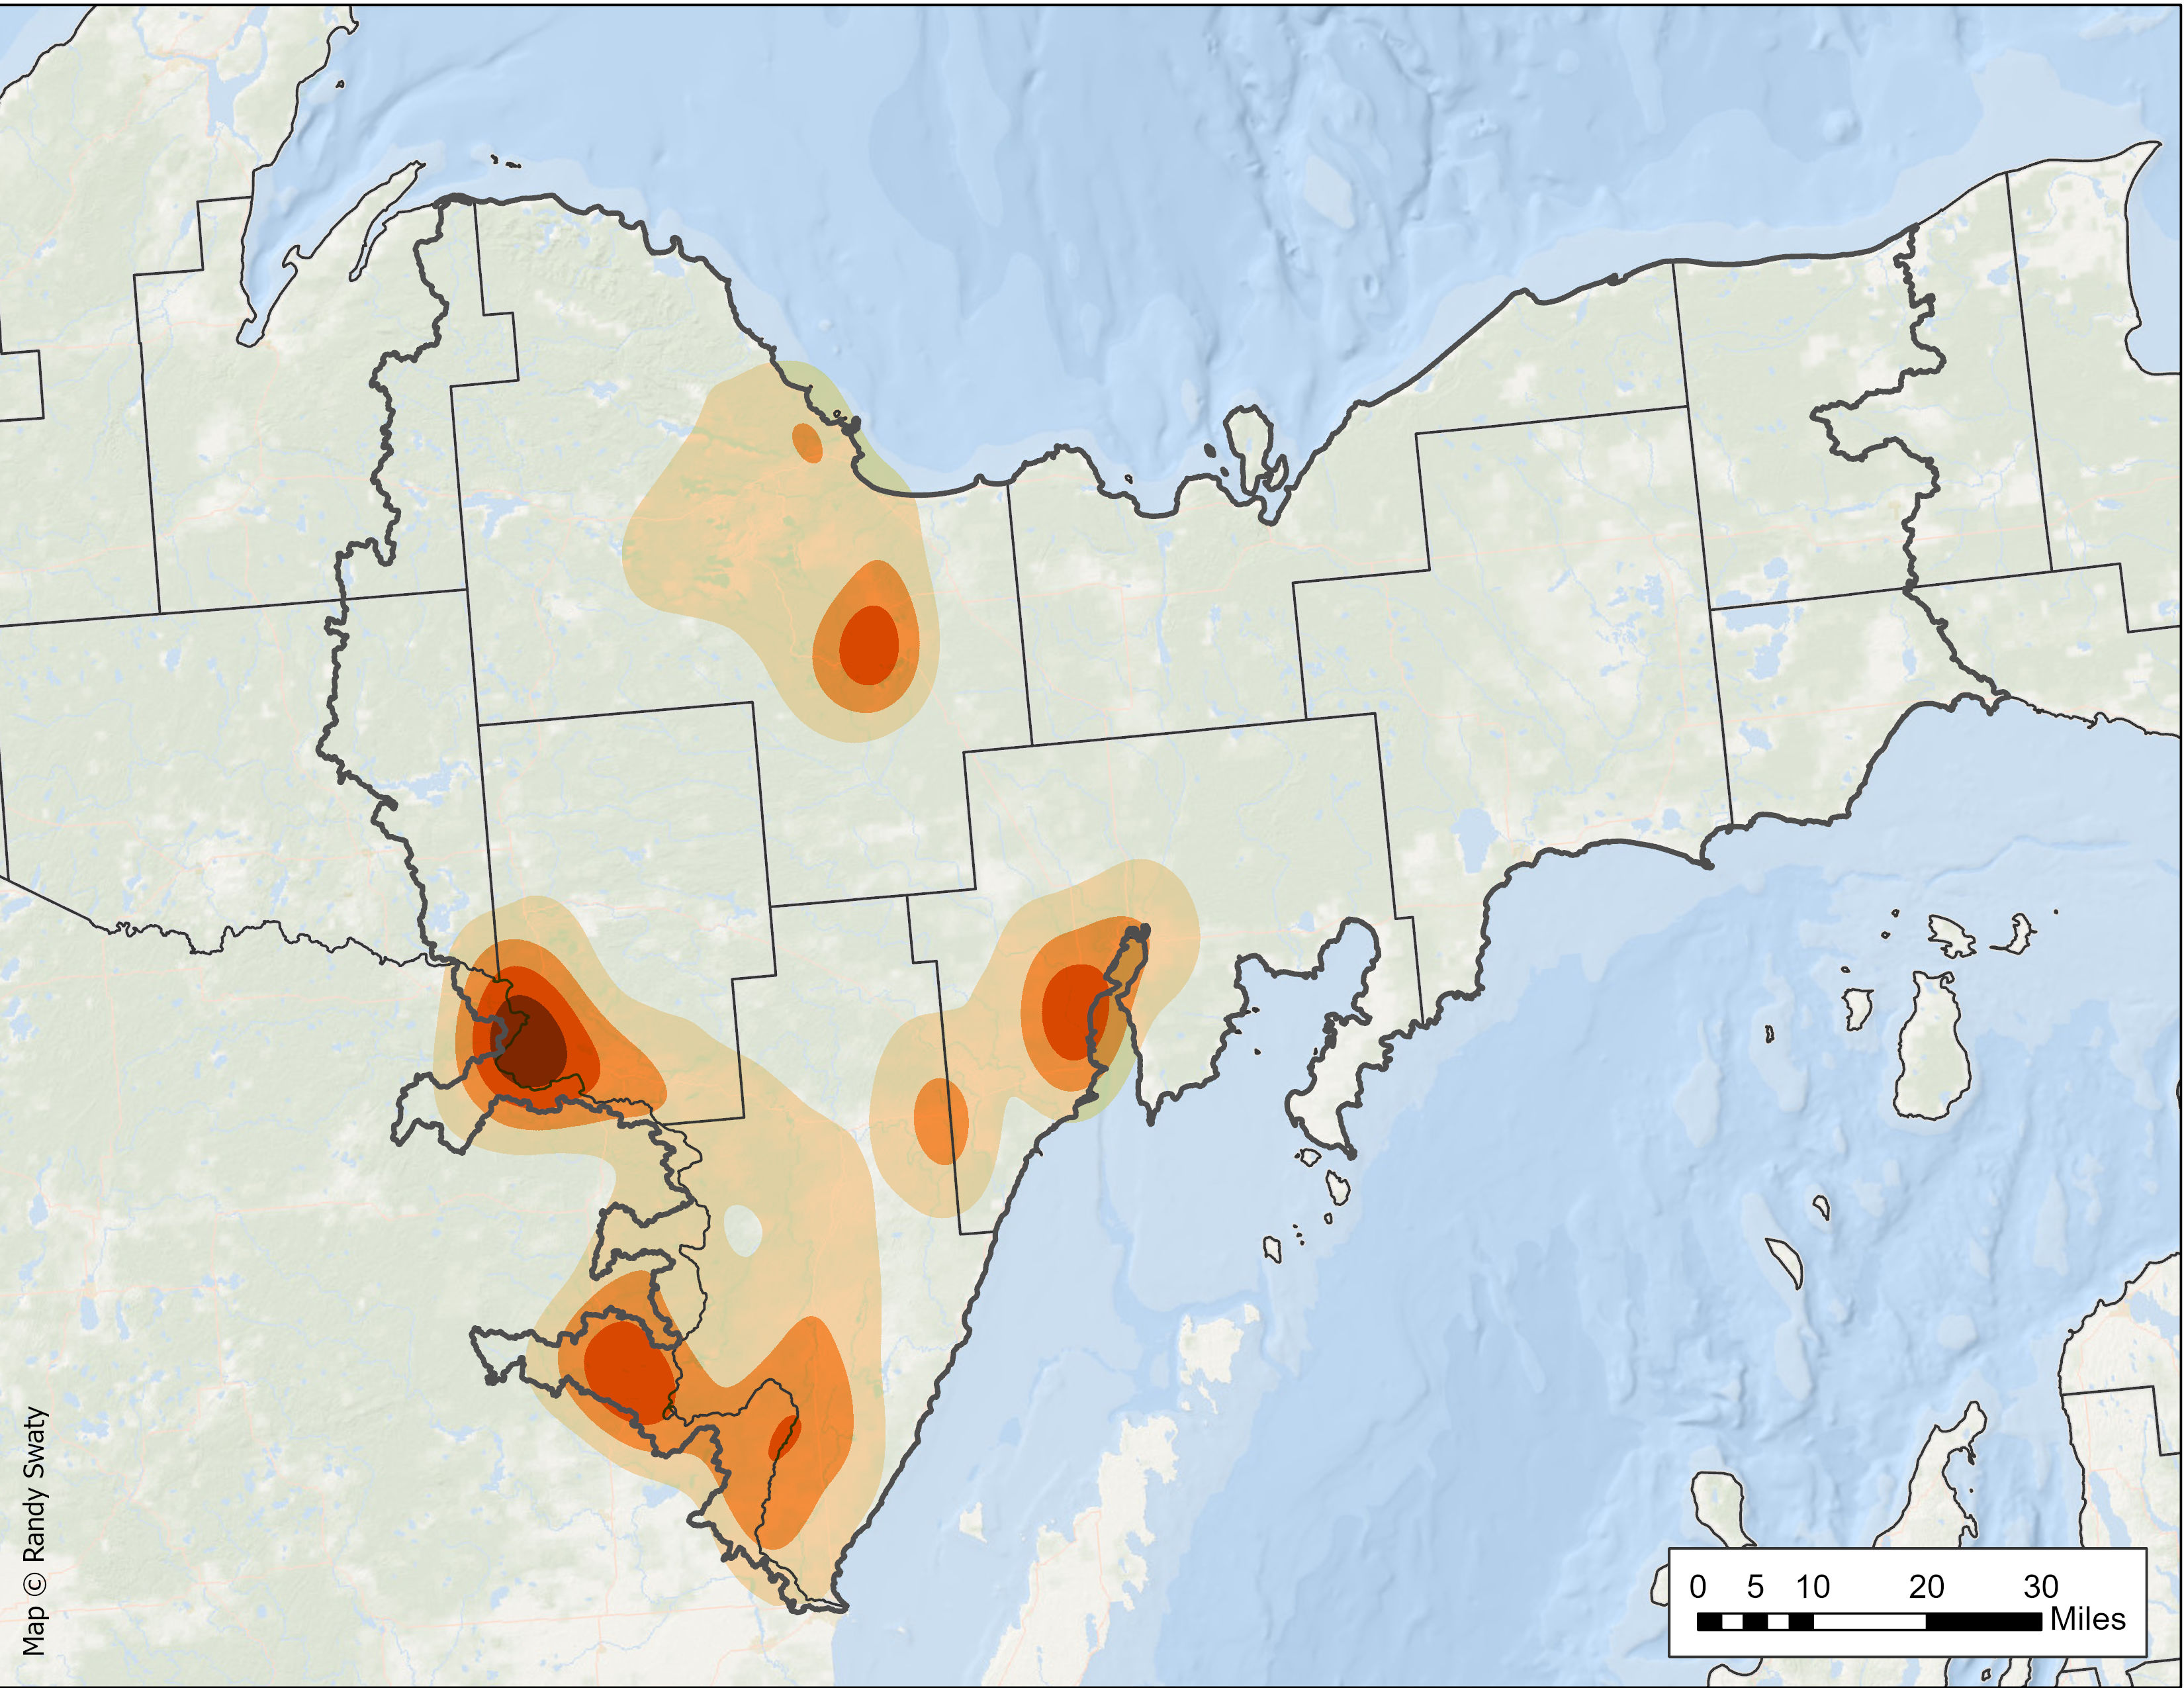
Recent fire activity
For context we explored recent fire activity in the area by downloading and mapping the Spatial wildfire occurance data for the United States, 1992-2020 (Short et al., 2022). We then generated a heatmap as a way to help understand where the greatest concentration of fires were during that time period.
We found:
- There were 2,336 fire occurrences recorded.
- Fires ranged from > 1 acre to ~21,000 acres.
- Annual acres burned ranged from 42 (1997) to >24,000 (2012).
- The heatmap indicates concentrations of fire activity around the Gwinn, Gladstone, Iron Mountain, Cedarville and Wallace, MI areas.
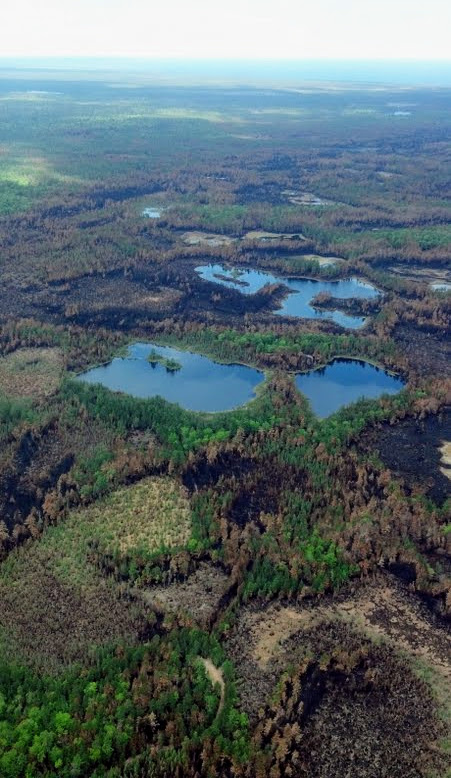
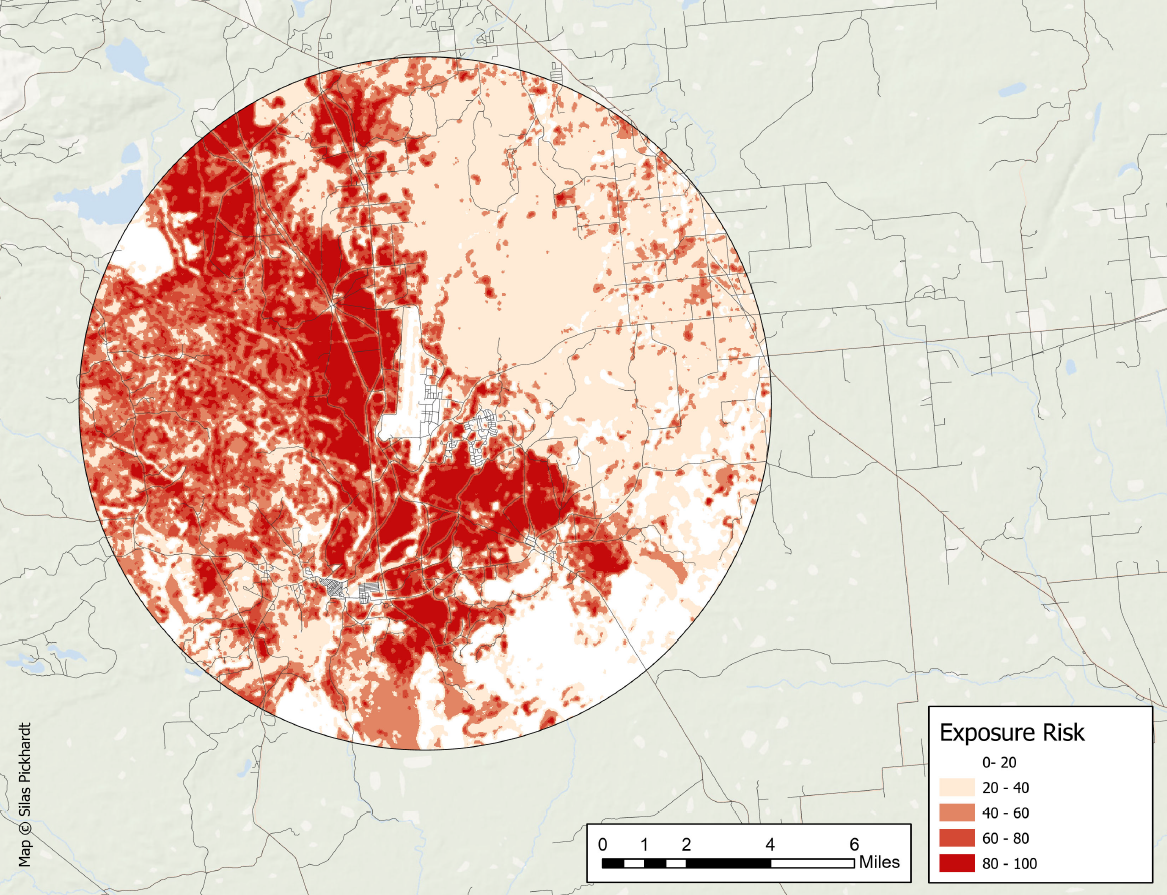
Zooming in to KI Sawyer
We found that Wildfire Exposure Risk was especially high around the KI Sawyer area, zoomed into below. This is largely due to the amount of Jack Pine forests in the vicinty. These forests are naturally fire-adapted, and often naturally regenerate only after a fire
Another view-Wildfire Risk to Communities
There are other ways to view and map wildfire risk, including the Wildfire Risk to Communities website. There, Wildfire Likelihood ‘is the probability of wildfire burning in any given year. At the community level, wildfire likelihood is averaged where housing units occur. Communities in all but the lowest classes need to be prepared for wildfire.’
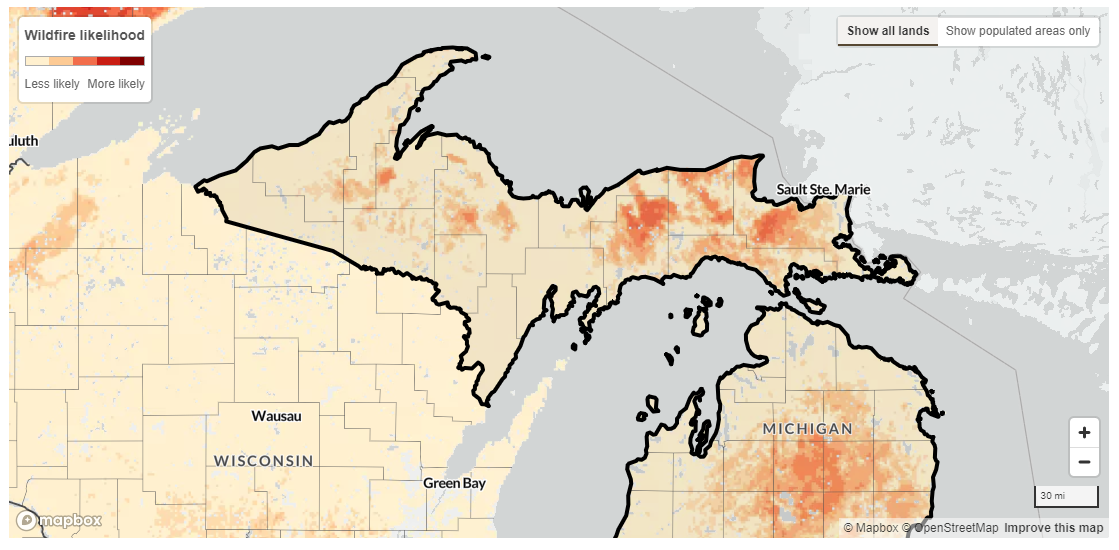
The Wildfire Exposure assessment relies primarily on landscape classification and the assigned flammability hazard for each Existing Vegetation Type. Alternativily, the Wildfire Risk to Communities incorporates weather and climate conditions, fuel model comparisons, and historical ignition data to predict burn probability and potential fire intensity. Although both assessments may appear similar, a notable difference emerges in the southern area adjacent to Lake Michigan. It’s crucial to recognize the limitations of fire behavior models, especially when dealing with varied inputs that are generalized. As climate change progresses, relying on sparse ignition records, broad weather data, and generalized fuel flammability assessments, particularly in lake states, can lead to significant gaps and exaggerations in the analysis (Ziel, personal communication).
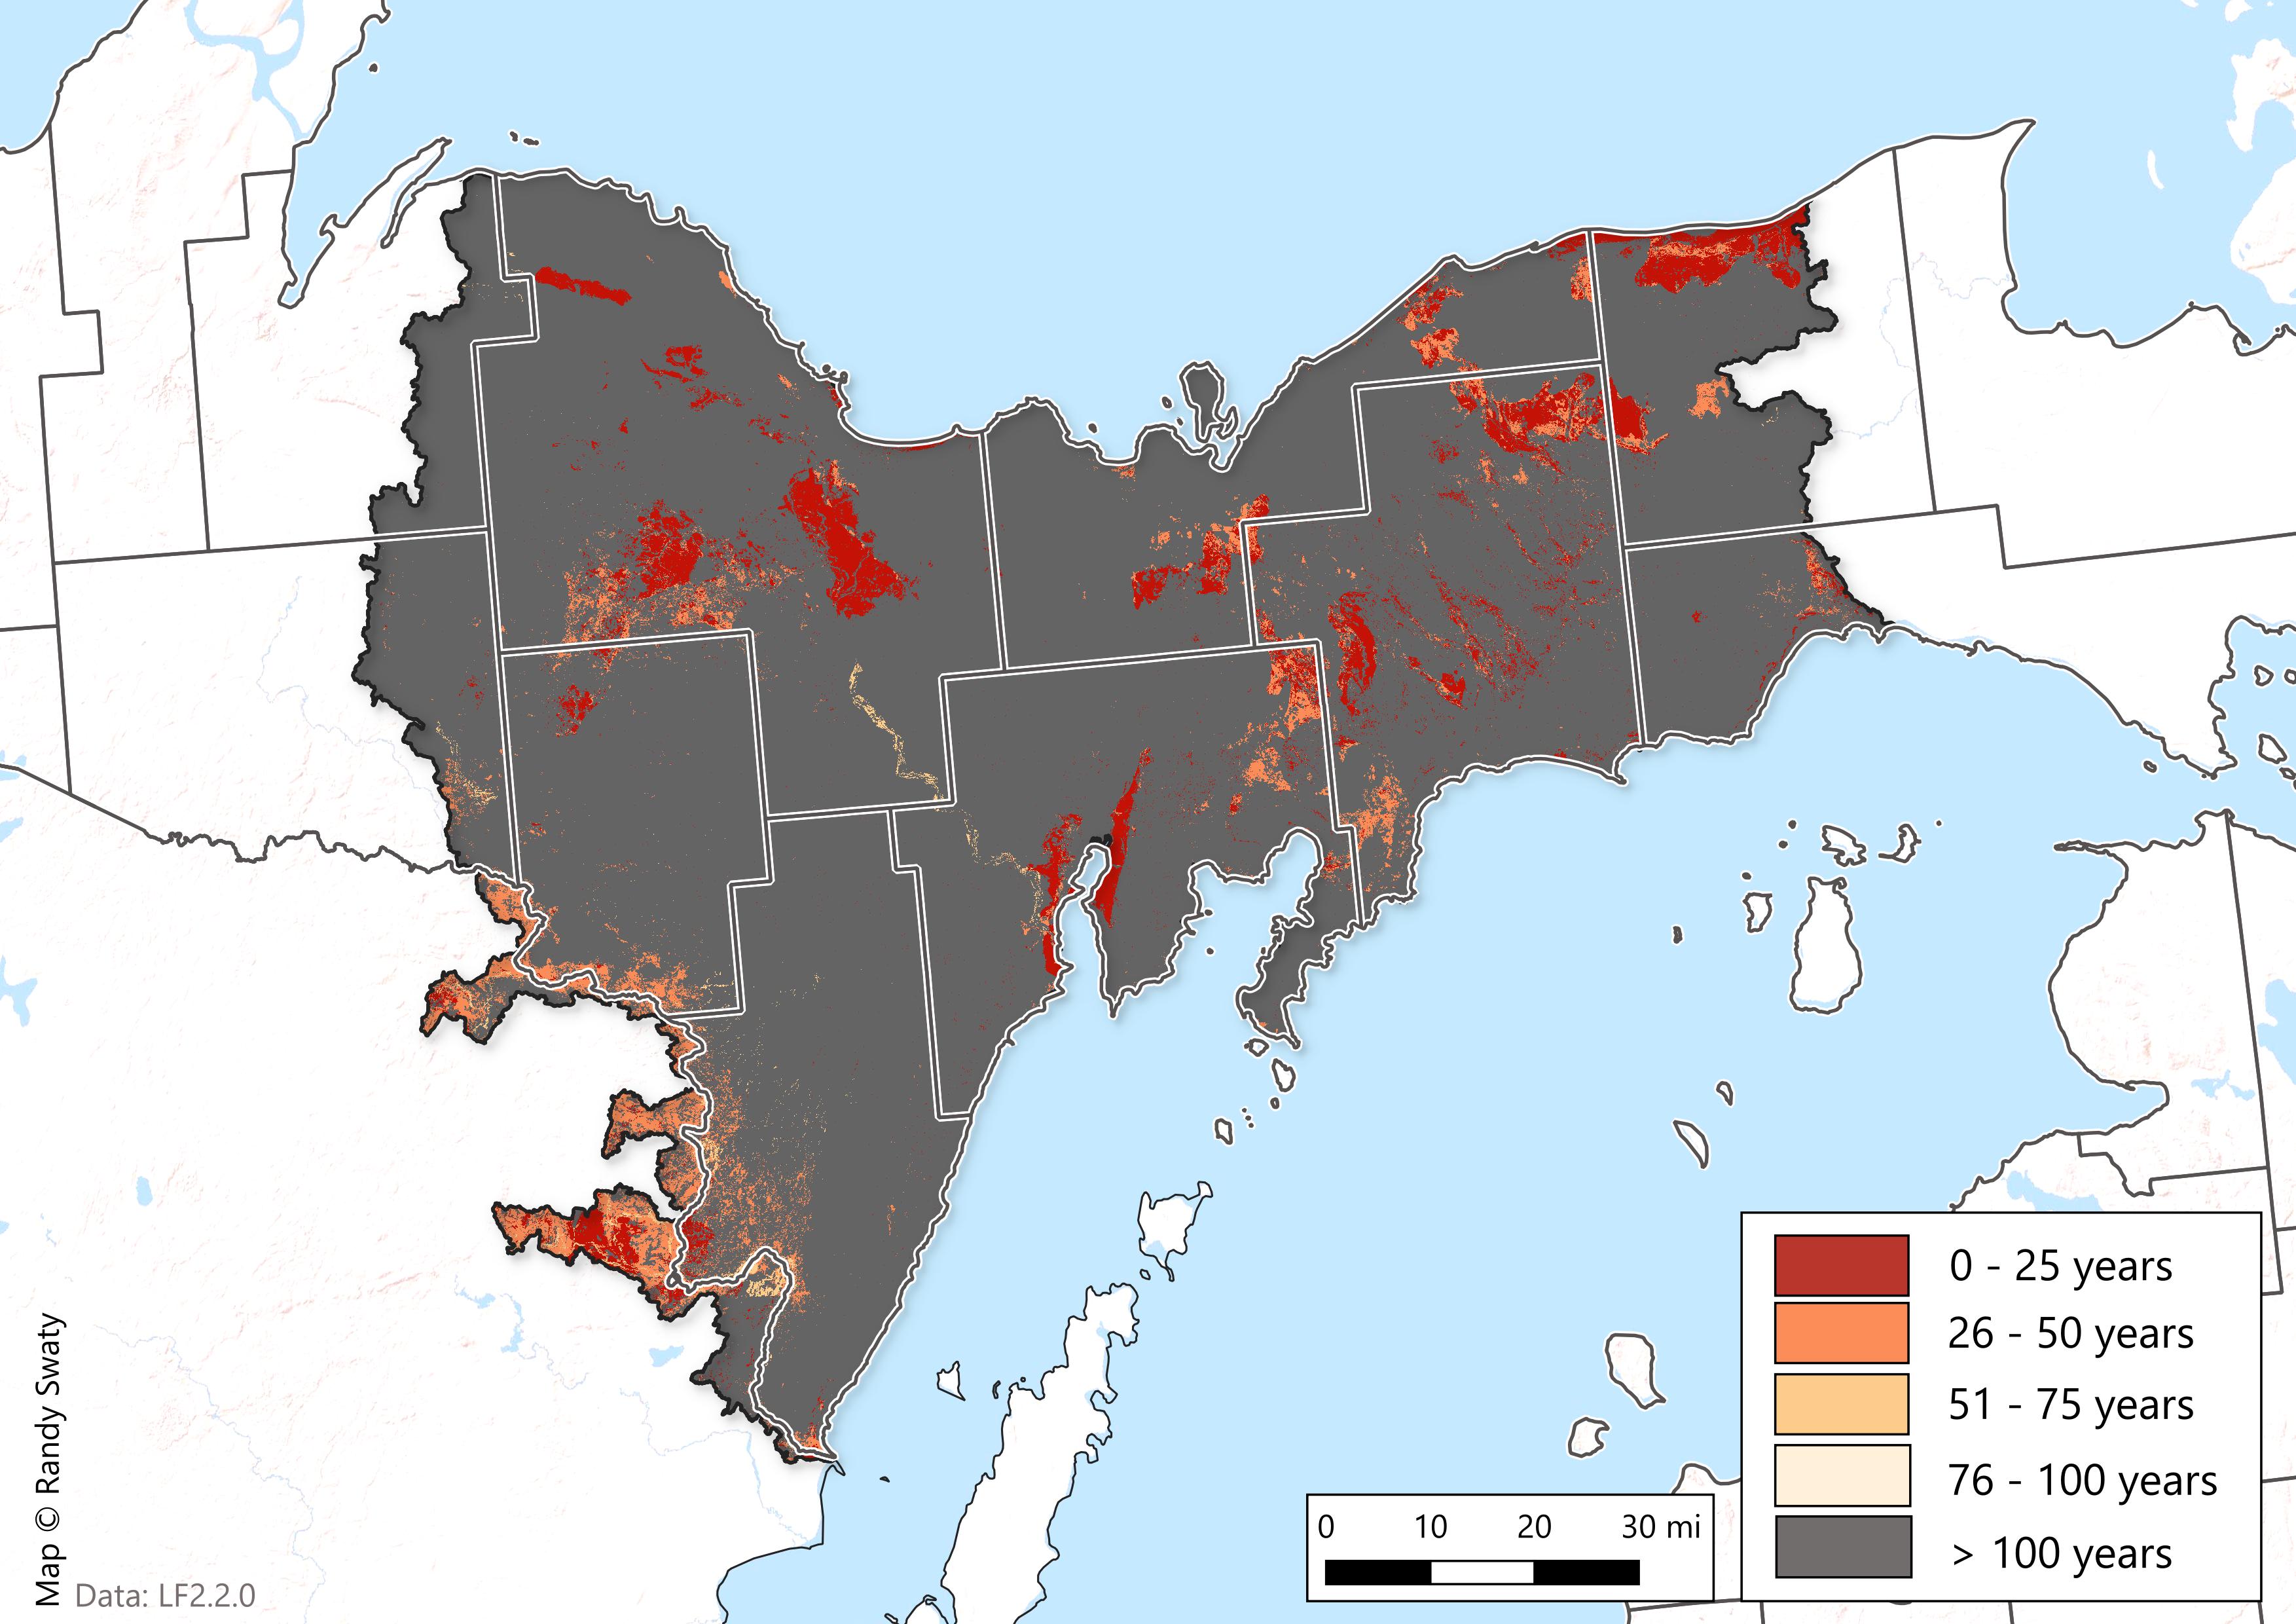
Historical Fire Regimes
While the past does not necessarily predict the future, we can learn from research on historical fire regimes for our area. The LANDFIRE modeled historical fire regimes based on literature and expert opinion. Those pre-European colonization return intervals (i.e., years between fires on average) are mapped below.